Descriptive Statistics: Textual & Graphical (pdf)
Descriptive Statistics: Textual & Graphical (pdf)
Descriptive Statistics: Textual & Graphical (pdf)

You also want an ePaper? Increase the reach of your titles
YUMPU automatically turns print PDFs into web optimized ePapers that Google loves.
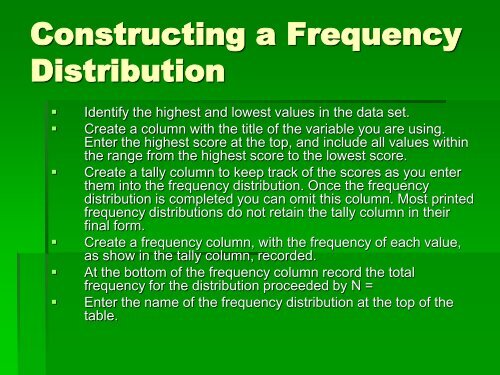
Constructing a Frequency<br />
Distribution<br />
• Identify the highest and lowest values in the data set.<br />
• Create a column with the title of the variable you are using.<br />
Enter the highest score at the top, and include all values within<br />
the range from the highest score to the lowest score.<br />
• Create a tally column to keep track of the scores as you enter<br />
them into the frequency distribution. Once the frequency<br />
distribution is completed you can omit this column. Most printed<br />
frequency distributions do not retain the tally column in their<br />
final form.<br />
• Create a frequency column, with the frequency of each value,<br />
as show in the tally column, recorded.<br />
• At the bottom of the frequency column record the total<br />
frequency for the distribution proceeded by N =<br />
• Enter the name of the frequency distribution at the top of the<br />
table.