Descriptive Statistics: Textual & Graphical (pdf)
Descriptive Statistics: Textual & Graphical (pdf)
Descriptive Statistics: Textual & Graphical (pdf)

You also want an ePaper? Increase the reach of your titles
YUMPU automatically turns print PDFs into web optimized ePapers that Google loves.
Clinic Example<br />
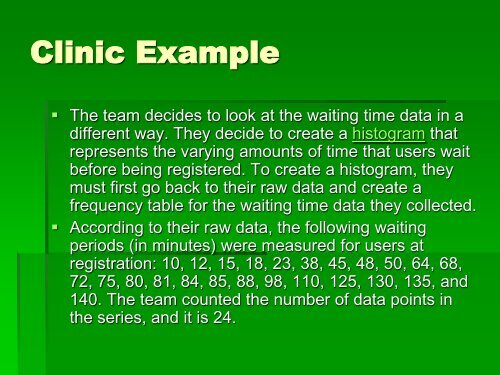
• The team decides to look at the waiting time data in a<br />
different way. They decide to create a histogram that<br />
represents the varying amounts of time that users wait<br />
before being registered. To create a histogram, they<br />
must first go back to their raw data and create a<br />
frequency table for the waiting time data they collected.<br />
• According to their raw data, the following waiting<br />
periods (in minutes) were measured for users at<br />
registration: 10, 12, 15, 18, 23, 38, 45, 48, 50, 64, 68,<br />
72, 75, 80, 81, 84, 85, 88, 98, 110, 125, 130, 135, and<br />
140. The team counted the number of data points in<br />
the series, and it is 24.