Descriptive Statistics: Textual & Graphical (pdf)
Descriptive Statistics: Textual & Graphical (pdf)
Descriptive Statistics: Textual & Graphical (pdf)

Create successful ePaper yourself
Turn your PDF publications into a flip-book with our unique Google optimized e-Paper software.
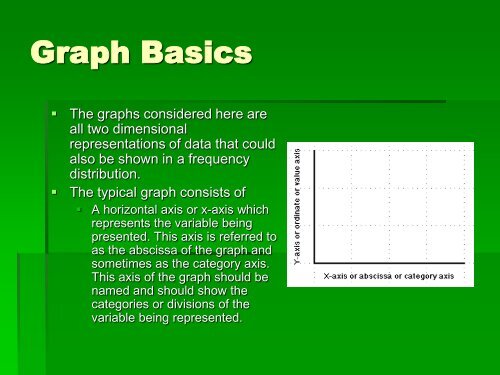
Graph Basics<br />
• The graphs considered here are<br />
all two dimensional<br />
representations of data that could<br />
also be shown in a frequency<br />
distribution.<br />
• The typical graph consists of<br />
• A horizontal axis or x-axis which<br />
represents the variable being<br />
presented. This axis is referred to<br />
as the abscissa of the graph and<br />
sometimes as the category axis.<br />
This axis of the graph should be<br />
named and should show the<br />
categories or divisions of the<br />
variable being represented.