Descriptive Statistics: Textual & Graphical (pdf)
Descriptive Statistics: Textual & Graphical (pdf)
Descriptive Statistics: Textual & Graphical (pdf)

You also want an ePaper? Increase the reach of your titles
YUMPU automatically turns print PDFs into web optimized ePapers that Google loves.
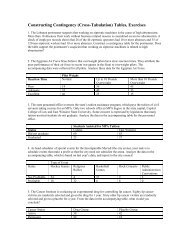
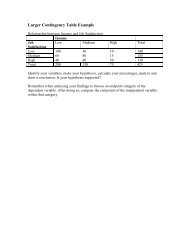
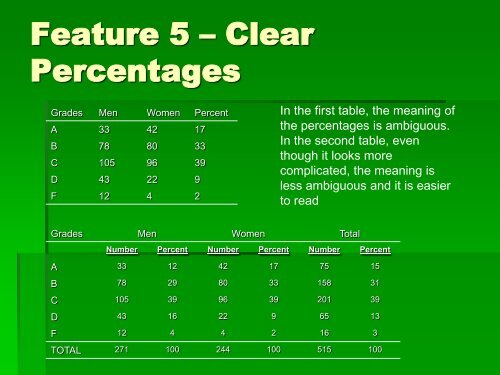
Feature 5 – Clear<br />
Percentages<br />
Grades Men Women Percent<br />
A 33 42 17<br />
B 78 80 33<br />
C 105 96 39<br />
D 43 22 9<br />
F 12 4 2<br />
In the first table, the meaning of<br />
the percentages is ambiguous.<br />
In the second table, even<br />
though it looks more<br />
complicated, the meaning is<br />
less ambiguous and it is easier<br />
to read<br />
Grades Men Women Total<br />
Number Percent Number Percent Number Percent<br />
A 33 12 42 17 75 15<br />
B 78 29 80 33 158 31<br />
C 105 39 96 39 201 39<br />
D 43 16 22 9 65 13<br />
F 12 4 4 2 16 3<br />
TOTAL 271 100 244 100 515 100