Descriptive Statistics: Textual & Graphical (pdf)
Descriptive Statistics: Textual & Graphical (pdf)
Descriptive Statistics: Textual & Graphical (pdf)
SHOW LESS

Create successful ePaper yourself
Turn your PDF publications into a flip-book with our unique Google optimized e-Paper software.
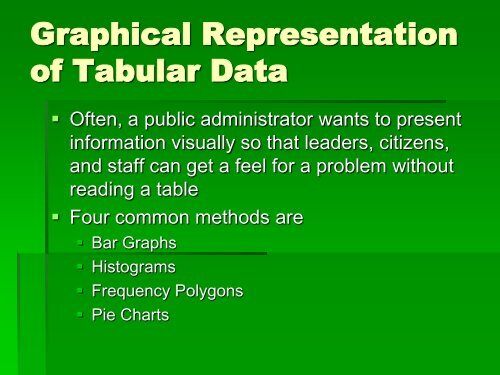
<strong>Graphical</strong> Representation<br />
of Tabular Data<br />
• Often, a public administrator wants to present<br />
information visually so that leaders, citizens,<br />
and staff can get a feel for a problem without<br />
reading a table<br />
• Four common methods are<br />
• Bar Graphs<br />
• Histograms<br />
• Frequency Polygons<br />
• Pie Charts