Descriptive Statistics: Textual & Graphical (pdf)
Descriptive Statistics: Textual & Graphical (pdf)
Descriptive Statistics: Textual & Graphical (pdf)
SHOW LESS

You also want an ePaper? Increase the reach of your titles
YUMPU automatically turns print PDFs into web optimized ePapers that Google loves.
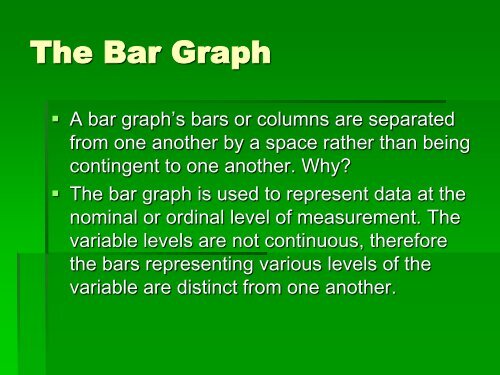
The Bar Graph<br />
• A bar graph’s bars or columns are separated<br />
from one another by a space rather than being<br />
contingent to one another. Why?<br />
• The bar graph is used to represent data at the<br />
nominal or ordinal level of measurement. The<br />
variable levels are not continuous, therefore<br />
the bars representing various levels of the<br />
variable are distinct from one another.