Descriptive Statistics: Textual & Graphical (pdf)
Descriptive Statistics: Textual & Graphical (pdf)
Descriptive Statistics: Textual & Graphical (pdf)

You also want an ePaper? Increase the reach of your titles
YUMPU automatically turns print PDFs into web optimized ePapers that Google loves.
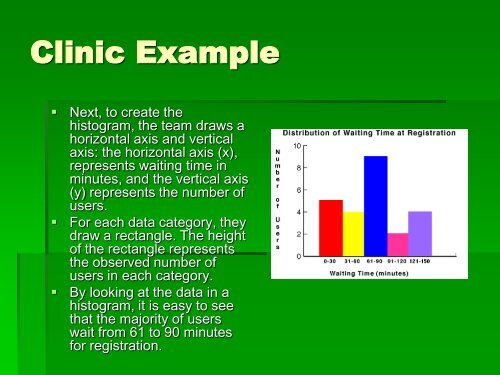
Clinic Example<br />
• Next, to create the<br />
histogram, the team draws a<br />
horizontal axis and vertical<br />
axis: the horizontal axis (x),<br />
represents waiting time in<br />
minutes, and the vertical axis<br />
(y) represents the number of<br />
users.<br />
• For each data category, they<br />
draw a rectangle. The height<br />
of the rectangle represents<br />
the observed number of<br />
users in each category.<br />
• By looking at the data in a<br />
histogram, it is easy to see<br />
that the majority of users<br />
wait from 61 to 90 minutes<br />
for registration.