Descriptive Statistics: Textual & Graphical (pdf)
Descriptive Statistics: Textual & Graphical (pdf)
Descriptive Statistics: Textual & Graphical (pdf)

Create successful ePaper yourself
Turn your PDF publications into a flip-book with our unique Google optimized e-Paper software.
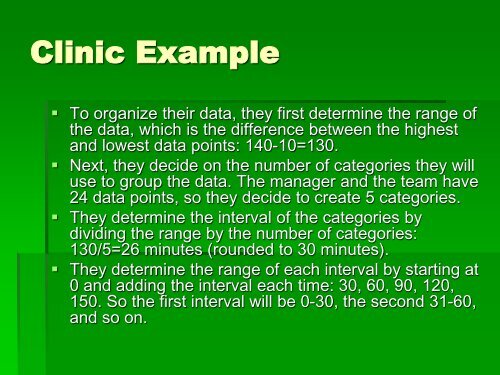
Clinic Example<br />
• To organize their data, they first determine the range of<br />
the data, which is the difference between the highest<br />
and lowest data points: 140-10=130.<br />
• Next, they decide on the number of categories they will<br />
use to group the data. The manager and the team have<br />
24 data points, so they decide to create 5 categories.<br />
• They determine the interval of the categories by<br />
dividing the range by the number of categories:<br />
130/5=26 minutes (rounded to 30 minutes).<br />
• They determine the range of each interval by starting at<br />
0 and adding the interval each time: 30, 60, 90, 120,<br />
150. So the first interval will be 0-30, the second 31-60,<br />
and so on.