Descriptive Statistics: Textual & Graphical (pdf)
Descriptive Statistics: Textual & Graphical (pdf)
Descriptive Statistics: Textual & Graphical (pdf)

Create successful ePaper yourself
Turn your PDF publications into a flip-book with our unique Google optimized e-Paper software.
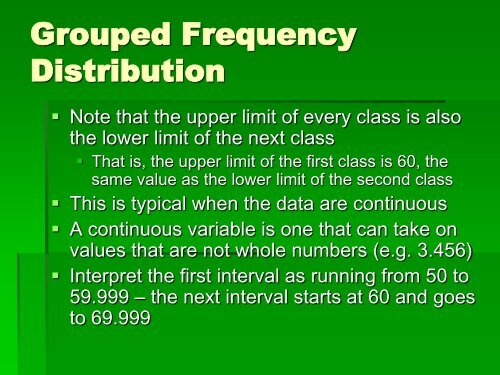
Grouped Frequency<br />
Distribution<br />
• Note that the upper limit of every class is also<br />
the lower limit of the next class<br />
• That is, the upper limit of the first class is 60, the<br />
same value as the lower limit of the second class<br />
• This is typical when the data are continuous<br />
• A continuous variable is one that can take on<br />
values that are not whole numbers (e.g. 3.456)<br />
• Interpret the first interval as running from 50 to<br />
59.999 – the next interval starts at 60 and goes<br />
to 69.999