Descriptive Statistics: Textual & Graphical (pdf)
Descriptive Statistics: Textual & Graphical (pdf)
Descriptive Statistics: Textual & Graphical (pdf)

Create successful ePaper yourself
Turn your PDF publications into a flip-book with our unique Google optimized e-Paper software.
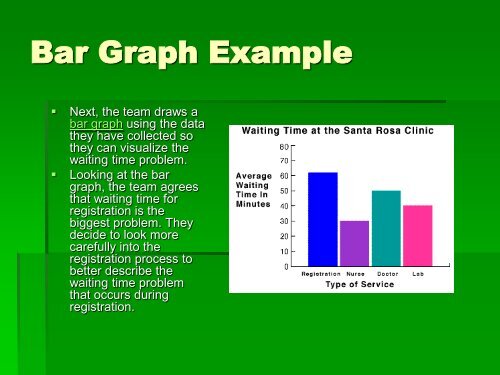
Bar Graph Example<br />
• Next, the team draws a<br />
bar graph using the data<br />
they have collected so<br />
they can visualize the<br />
waiting time problem.<br />
• Looking at the bar<br />
graph, the team agrees<br />
that waiting time for<br />
registration is the<br />
biggest problem. They<br />
decide to look more<br />
carefully into the<br />
registration process to<br />
better describe the<br />
waiting time problem<br />
that occurs during<br />
registration.