Sunshine Coast Aquatic Plan 2011-2026 - Sunshine Coast Council
Sunshine Coast Aquatic Plan 2011-2026 - Sunshine Coast Council
Sunshine Coast Aquatic Plan 2011-2026 - Sunshine Coast Council

You also want an ePaper? Increase the reach of your titles
YUMPU automatically turns print PDFs into web optimized ePapers that Google loves.
4.7 Benchmarking<br />
A benchmarking exercise was undertaken to<br />
compare the level of provision and current<br />
adequacy of the <strong>Sunshine</strong> <strong>Coast</strong> aquatic<br />
facility network against other Queensland<br />
local governments. The council provision of<br />
aquatic facilities are illustrated in Figure 6:<br />
Comparing the number of persons with the<br />
number of council owned aquatic complexes<br />
and Figure 7: Comparing the number of<br />
persons with the amount of council provided<br />
water space. It should be noted however that<br />
benchmarking comparisons do not evaluate the<br />
total community accessible aquatic water space<br />
opportunities within each region, including<br />
provisions through educational institutions and<br />
private operators.<br />
It is evident that the <strong>Sunshine</strong> <strong>Coast</strong> population<br />
is well serviced for both the number of aquatic<br />
facilities and amount of water space provided<br />
when compared to like local government areas.<br />
Some local government areas have the benefit<br />
of university, educational institutions and other<br />
philanthropic organisations which provide<br />
community accessible aquatic infrastructure to<br />
the local government aquatic network and this<br />
is not reflected within the provision ratios.<br />
4.8 2009/10 Financial performance<br />
of council owned and funded<br />
facilities<br />
In 2009/10 circa $5.7 million was invested in<br />
the regional aquatic network. <strong>Council</strong> revenues<br />
from all pools over the period was reported to<br />
be $1,562,201 with total operating expenses<br />
of $4,624,544 and capital works totalling<br />
$2,628,500. This represents an operating<br />
deficit of $3.1 million, which equates to $9.56<br />
per capita 8 or $20.69 per rateable property. A<br />
breakdown of this annual investment identifies<br />
that 94 per cent of the previous annual budget<br />
was invested into operating, maintaining and<br />
developing council owned facilities and around<br />
2 per cent was invested into non-council<br />
facilities to enable community access to those<br />
facilities. The balance was expended on overall<br />
management and other fixed costs of council.<br />
8<br />
323,423 person based on Australian Bureau of<br />
Statistics 2010<br />
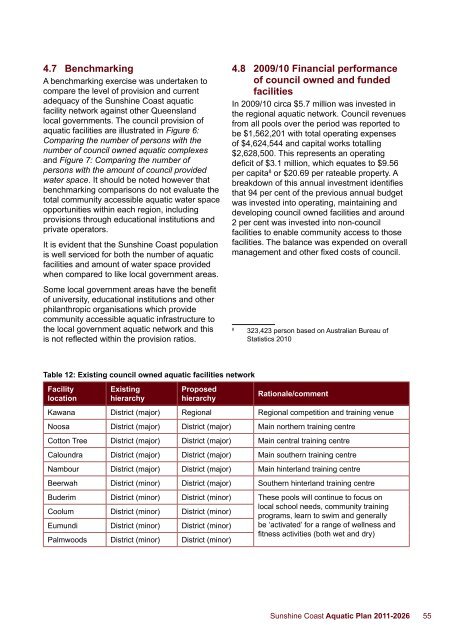
Table 12: Existing council owned aquatic facilities network<br />
Facility<br />
location<br />
Existing<br />
hierarchy<br />
Proposed<br />
hierarchy<br />
Rationale/comment<br />
Kawana District (major) Regional Regional competition and training venue<br />
Noosa District (major) District (major) Main northern training centre<br />
Cotton Tree District (major) District (major) Main central training centre<br />
Caloundra District (major) District (major) Main southern training centre<br />
Nambour District (major) District (major) Main hinterland training centre<br />
Beerwah District (minor) District (major) Southern hinterland training centre<br />
Buderim District (minor) District (minor) These pools will continue to focus on<br />
Coolum District (minor) District (minor)<br />
local school needs, community training<br />
programs, learn to swim and generally<br />
Eumundi District (minor) District (minor) be ‘activated’ for a range of wellness and<br />
Palmwoods District (minor) District (minor)<br />
fitness activities (both wet and dry)<br />
<strong>Sunshine</strong> <strong>Coast</strong> <strong>Aquatic</strong> <strong>Plan</strong> <strong>2011</strong>-<strong>2026</strong> 55