TPSEAL 2010 Financial Results. - Serena Hotels
TPSEAL 2010 Financial Results. - Serena Hotels
TPSEAL 2010 Financial Results. - Serena Hotels

You also want an ePaper? Increase the reach of your titles
YUMPU automatically turns print PDFs into web optimized ePapers that Google loves.
Notes to the <strong>Financial</strong> Statements (continued)<br />
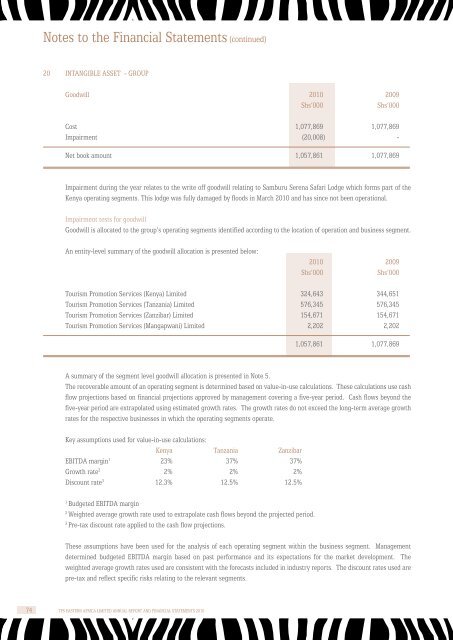
20 INTANGIBLE ASSET - GROUP<br />
Goodwill <strong>2010</strong> 2009<br />
Shs’000<br />
Shs’000<br />
Cost 1,077,869 1,077,869<br />
Impairment (20,008) -<br />
Net book amount 1,057,861 1,077,869<br />
Impairment during the year relates to the write off goodwill relating to Samburu <strong>Serena</strong> Safari Lodge which forms part of the<br />
Kenya operating segments. This lodge was fully damaged by floods in March <strong>2010</strong> and has since not been operational.<br />
Impairment tests for goodwill<br />
Goodwill is allocated to the group’s operating segments identified according to the location of operation and business segment.<br />
An entity-level summary of the goodwill allocation is presented below:<br />
<strong>2010</strong> 2009<br />
Shs’000<br />
Shs’000<br />
Tourism Promotion Services (Kenya) Limited 324,643 344,651<br />
Tourism Promotion Services (Tanzania) Limited 576,345 576,345<br />
Tourism Promotion Services (Zanzibar) Limited 154,671 154,671<br />
Tourism Promotion Services (Mangapwani) Limited 2,202 2,202<br />
1,057,861 1,077,869<br />
A summary of the segment level goodwill allocation is presented in Note 5.<br />
The recoverable amount of an operating segment is determined based on value-in-use calculations. These calculations use cash<br />
flow projections based on financial projections approved by management covering a five-year period. Cash flows beyond the<br />
five-year period are extrapolated using estimated growth rates. The growth rates do not exceed the long-term average growth<br />
rates for the respective businesses in which the operating segments operate.<br />
Key assumptions used for value-in-use calculations:<br />
Kenya Tanzania Zanzibar<br />
EBITDA margin 1 23% 37% 37%<br />
Growth rate 2 2% 2% 2%<br />
Discount rate 3 12.3% 12.5% 12.5%<br />
1<br />
Budgeted EBITDA margin<br />
2<br />
Weighted average growth rate used to extrapolate cash flows beyond the projected period.<br />
3<br />
Pre-tax discount rate applied to the cash flow projections.<br />
These assumptions have been used for the analysis of each operating segment within the business segment. Management<br />
determined budgeted EBITDA margin based on past performance and its expectations for the market development. The<br />
weighted average growth rates used are consistent with the forecasts included in industry reports. The discount rates used are<br />
pre-tax and reflect specific risks relating to the relevant segments.<br />
74 TPS EASTERN AFRICA LIMITED ANNUAL REPORT AND FINANCIAL STATEMENTS <strong>2010</strong>