Overview - MPC
Overview - MPC
Overview - MPC

You also want an ePaper? Increase the reach of your titles
YUMPU automatically turns print PDFs into web optimized ePapers that Google loves.
2009<br />
CHAPTER 3<br />
International Productivity<br />
Comparison of Selected Services<br />
Sub-sectors<br />
• In 2009, Malaysia’s services sector<br />
performed better than services sector<br />
of Singapore, Hong Kong and Republic<br />
of Korea. Malaysia’s services sector<br />
recorded 1.1% productivity growth as<br />
compared with Singapore, Hong Kong<br />
and Republic of Korea which registered<br />
contraction at 4.8%, 2.4% and 0.6%<br />
respectively.<br />
Table 3.1: Productivity Growth in the Services Sector<br />
for Selected Asian Countries, 2009<br />
Country<br />
Malaysia<br />
Singapore<br />
Hong Kong<br />
Republic of Korea<br />
Indonesia<br />
Growth (%)<br />
1.13<br />
-4.82<br />
-2.36<br />
-0.60<br />
5.82<br />
Computed from:<br />
- Economic Reports, Ministry of Finance, Malaysia<br />
- Economic Survey of Singapore, Ministry of Manpower, Singapore<br />
- Hong Kong in Figures, 2010 Edition, Census and Statistics Department<br />
of Hong Kong.<br />
- Asian Development Bank<br />
- Statistics Department of Indonesia<br />
• The better performance of the services<br />
sector in Malaysia was contributed by<br />
effective Government policies such as<br />
introduction of stimulus packages which<br />
has resulted an increased in domestic<br />
demand.<br />
Total Factor Productivity<br />
• During the period 2000-2009, the<br />
services sector registered a TFP growth<br />
of 1.7%. The contribution of TFP growth<br />
to the services sector output was<br />
26.5% while contributions from labour<br />
and capital were 37.5% and 36.0%<br />
respectively (Table 3.2).<br />
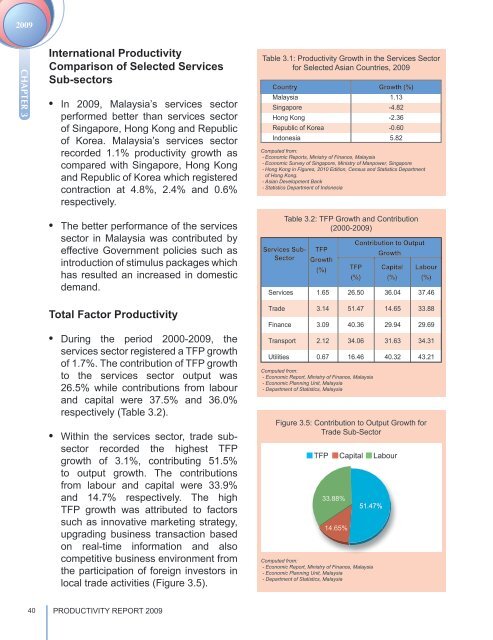
• Within the services sector, trade subsector<br />
recorded the highest TFP<br />
growth of 3.1%, contributing 51.5%<br />
to output growth. The contributions<br />
from labour and capital were 33.9%<br />
and 14.7% respectively. The high<br />
TFP growth was attributed to factors<br />
such as innovative marketing strategy,<br />
upgrading business transaction based<br />
on real-time information and also<br />
competitive business environment from<br />
the participation of foreign investors in<br />
local trade activities (Figure 3.5).<br />
Table 3.2: TFP Growth and Contribution<br />
(2000-2009)<br />
Services Sub-<br />
Sector<br />
Services<br />
Trade<br />
Finance<br />
Transport<br />
Utilities<br />
TFP<br />
Growth<br />
(%)<br />
1.65<br />
3.14<br />
3.09<br />
2.12<br />
0.67<br />
Contribution to Output<br />
TFP<br />
(%)<br />
26.50<br />
51.47<br />
40.36<br />
34.06<br />
16.46<br />
Computed from:<br />
- Economic Report, Ministry of Finance, Malaysia<br />
- Economic Planning Unit, Malaysia<br />
- Department of Statistics, Malaysia<br />
Growth<br />
Capital<br />
(%)<br />
36.04<br />
14.65<br />
29.94<br />
31.63<br />
40.32<br />
Labour<br />
(%)<br />
37.46<br />
33.88<br />
29.69<br />
34.31<br />
43.21<br />
Figure 3.5: Contribution to Output Growth for<br />
Trade Sub-Sector<br />
TFP Capital Labour<br />
33.88%<br />
14.65%<br />
51.47%<br />
Computed from:<br />
- Economic Report, Ministry of Finance, Malaysia<br />
- Economic Planning Unit, Malaysia<br />
- Department of Statistics, Malaysia<br />
40<br />
PRODUCTIVITY REPORT 2009