1998 SOUTHERN AFRICA ECONOMIC ... - National Treasury
1998 SOUTHERN AFRICA ECONOMIC ... - National Treasury
1998 SOUTHERN AFRICA ECONOMIC ... - National Treasury

You also want an ePaper? Increase the reach of your titles
YUMPU automatically turns print PDFs into web optimized ePapers that Google loves.
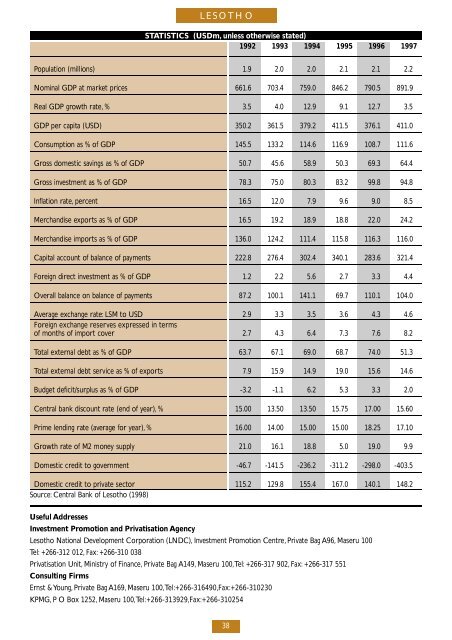
L E S O T H O<br />
S TATISTICS (U S D m ,unless otherwise stated)<br />
1 9 9 2 1 9 9 3 1 9 9 4 1 9 9 5 1 9 9 6 1 9 9 7<br />
Population (millions) 1 . 9 2 . 0 2 . 0 2 . 1 2 . 1 2 . 2<br />
Nominal GDP at market prices 6 6 1 . 6 7 0 3 . 4 7 5 9 . 0 8 4 6 . 2 7 9 0 . 5 8 9 1 . 9<br />
Real GDP growth rate, % 3 . 5 4 . 0 1 2 . 9 9 . 1 1 2 . 7 3 . 5<br />
GDP per capita (USD) 3 5 0 . 2 3 6 1 . 5 3 7 9 . 2 4 1 1 . 5 3 7 6 . 1 4 1 1 . 0<br />
Consumption as % of GDP 1 4 5 . 5 1 3 3 . 2 1 1 4 . 6 1 1 6 . 9 1 0 8 . 7 1 1 1 . 6<br />
G ross domestic savings as % of GDP 5 0 . 7 4 5 . 6 5 8 . 9 5 0 . 3 6 9 . 3 6 4 . 4<br />
G ross investment as % of GDP 7 8 . 3 7 5 . 0 8 0 . 3 8 3 . 2 9 9 . 8 9 4 . 8<br />
Inflation rate, p e rc e n t 1 6 . 5 1 2 . 0 7 . 9 9 . 6 9 . 0 8 . 5<br />
M e rchandise exports as % of GDP 1 6 . 5 1 9 . 2 1 8 . 9 1 8 . 8 2 2 . 0 2 4 . 2<br />
M e rchandise imports as % of GDP 1 3 6 . 0 1 2 4 . 2 1 1 1 . 4 1 1 5 . 8 1 1 6 . 3 1 1 6 . 0<br />
C apital account of balance of payments 2 2 2 . 8 2 7 6 . 4 3 0 2 . 4 3 4 0 . 1 2 8 3 . 6 3 2 1 . 4<br />
Fo reign direct investment as % of GDP 1 . 2 2 . 2 5 . 6 2 . 7 3 . 3 4 . 4<br />
O verall balance on balance of payments 8 7 . 2 1 0 0 . 1 1 4 1 . 1 6 9 . 7 1 1 0 . 1 1 0 4 . 0<br />
Average exchange rate: LSM to USD 2 . 9 3 . 3 3 . 5 3 . 6 4 . 3 4 . 6<br />
Foreign exchange reserves expressed in terms<br />
of months of import cove r 2 . 7 4 . 3 6 . 4 7 . 3 7 . 6 8 . 2<br />
Total external debt as % of GDP 6 3 . 7 6 7 . 1 6 9 . 0 6 8 . 7 7 4 . 0 5 1 . 3<br />
Total external debt service as % of export s 7 . 9 1 5 . 9 1 4 . 9 1 9 . 0 1 5 . 6 1 4 . 6<br />
Budget deficit/surplus as % of GDP - 3 . 2 - 1 . 1 6 . 2 5 . 3 3 . 3 2 . 0<br />
Central bank discount rate (end of ye a r ) ,% 1 5 . 0 0 1 3 . 5 0 1 3 . 5 0 1 5 . 7 5 1 7 . 0 0 1 5 . 6 0<br />
Prime lending rate (average for ye a r ) ,% 1 6 . 0 0 1 4 . 0 0 1 5 . 0 0 1 5 . 0 0 1 8 . 2 5 1 7 . 1 0<br />
G rowth rate of M2 money supply 2 1 . 0 1 6 . 1 1 8 . 8 5 . 0 1 9 . 0 9 . 9<br />
Domestic credit to government - 4 6 . 7 - 1 4 1 . 5 - 2 3 6 . 2 - 3 1 1 . 2 - 2 9 8 . 0 - 4 0 3 . 5<br />
Domestic credit to private sector 115 . 2 129 . 8 155 . 4 167 . 0 140 . 1 148 . 2<br />
S o u rc e :Central Bank of Lesotho (<strong>1998</strong>)<br />
Useful A dd re s s e s<br />
I nvestment Promotion and Privatisation A ge n c y<br />
Lesotho <strong>National</strong> Development Corporation (LNDC), I nvestment Promotion Centre, Private Bag A 96 ,Maseru 100<br />
Te l : +266-312 012, F a x :+266-310 038<br />
Privatisation Unit, M i n i s t ry of Finance, Private Bag A 149 ,Maseru 100,Te l :+266-317 902, F a x :+266-317 551<br />
Consulting Firms<br />
Ernst & Yo u n g ,Private Bag A 169 ,Maseru 100,Te l :+ 266 - 316490 ,F a x :+ 266 - 310230<br />
K P M G ,P O Box 1252, Maseru 100,Te l :+ 266 - 313929 ,F a x :+ 266 - 310254<br />
38