

gnuplot documentation
gnuplot documentation
gnuplot documentation

Create successful ePaper yourself
Turn your PDF publications into a flip-book with our unique Google optimized e-Paper software.
32 HISTOGRAMS <strong>gnuplot</strong> 4.3 45<br />
The fsteps style is only relevant to 2D plotting. It<br />
connects consecutive points with two line segments:<br />
the first from (x1,y1) to (x1,y2) and the second from<br />
(x1,y2) to (x2,y2). The input column requires are<br />
the same as for plot styles lines and points. The<br />
difference between fsteps and steps is that fsteps<br />
traces first the change in y and then the change in<br />
x. steps traces first the change in x and then the<br />
change in y.<br />
See also<br />
steps demo.<br />
with fsteps<br />
31 Histeps<br />
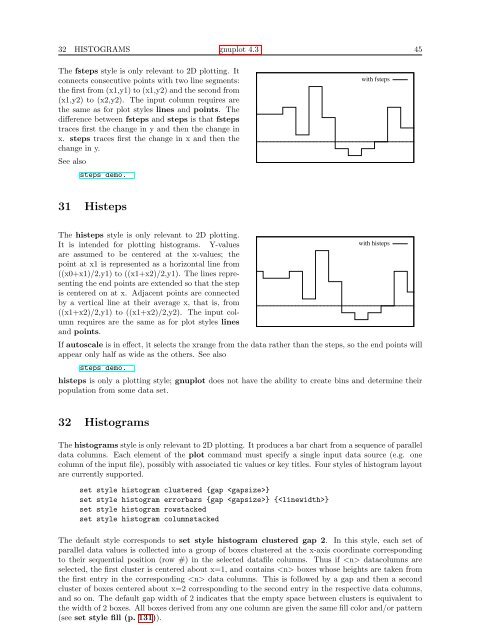
The histeps style is only relevant to 2D plotting.<br />
It is intended for plotting histograms. Y-values<br />
are assumed to be centered at the x-values; the<br />
point at x1 is represented as a horizontal line from<br />
((x0+x1)/2,y1) to ((x1+x2)/2,y1). The lines representing<br />
the end points are extended so that the step<br />
is centered on at x. Adjacent points are connected<br />
by a vertical line at their average x, that is, from<br />
((x1+x2)/2,y1) to ((x1+x2)/2,y2). The input column<br />
requires are the same as for plot styles lines<br />
and points.<br />
with histeps<br />
If autoscale is in effect, it selects the xrange from the data rather than the steps, so the end points will<br />
appear only half as wide as the others. See also<br />
steps demo.<br />
histeps is only a plotting style; <strong>gnuplot</strong> does not have the ability to create bins and determine their<br />
population from some data set.<br />
32 Histograms<br />
The histograms style is only relevant to 2D plotting. It produces a bar chart from a sequence of parallel<br />
data columns. Each element of the plot command must specify a single input data source (e.g. one<br />
column of the input file), possibly with associated tic values or key titles. Four styles of histogram layout<br />
are currently supported.<br />
set style histogram clustered {gap }<br />
set style histogram errorbars {gap } {}<br />
set style histogram rowstacked<br />
set style histogram columnstacked<br />
The default style corresponds to set style histogram clustered gap 2. In this style, each set of<br />
parallel data values is collected into a group of boxes clustered at the x-axis coordinate corresponding<br />
to their sequential position (row #) in the selected datafile columns. Thus if datacolumns are<br />
selected, the first cluster is centered about x=1, and contains boxes whose heights are taken from<br />
the first entry in the corresponding data columns. This is followed by a gap and then a second<br />
cluster of boxes centered about x=2 corresponding to the second entry in the respective data columns,<br />
and so on. The default gap width of 2 indicates that the empty space between clusters is equivalent to<br />
the width of 2 boxes. All boxes derived from any one column are given the same fill color and/or pattern<br />
(see set style fill (p. 131)).


