

gnuplot documentation
gnuplot documentation
gnuplot documentation

You also want an ePaper? Increase the reach of your titles
YUMPU automatically turns print PDFs into web optimized ePapers that Google loves.
48 <strong>gnuplot</strong> 4.3 35 LABELS<br />
plane along two, not necessarily orthogonal, directions. In other words, groups of four adjacent points<br />
are assumed to form the same size parallelogram. The variable value in the tuples represent a palette<br />
color (gray value) for indexing in the current palette.<br />
Each pixel (data point) of the input 2D image will become a rectangle or parallelipiped in theplot. The<br />
coordinate of each data point will determine the center of the parallelipiped. That is, an M x N set of<br />
data will form an image with M x N pixels. This is slightly different than pm3d elements where an M x<br />
N set of data will form a surface of (M-1) x (N-1) elements. The scan directions for the image data grid<br />
can be any of eight possible combinations.<br />
See also rgbimage (p. 50).<br />
33.1 Image failsafe<br />
Some terminal drivers provide code to optimize rendering of image data within a rectangular 2D area.<br />
However this code is known to be imperfect (hence the label EXPERIMENTAL for image support in<br />
<strong>gnuplot</strong> version 4.2). This optimized code may be disabled by using the keyword failsafe. E.g.<br />
plot ’data’ with image failsafe<br />
Here are some specific comments about particular terminal drivers:<br />
x11 and wxt - Pixels are either repeated or decimated to fit the display resolution; no other processing<br />
(filtering) is done. Thus, aliasing may occur when decimating images having high spatial frequency<br />
content.<br />
postscript (pslatex, epslatex, pstex) - Image is copied in its original resolution, and sample interpolation<br />
is turned off.<br />
See also rgbimage (p. 50).<br />
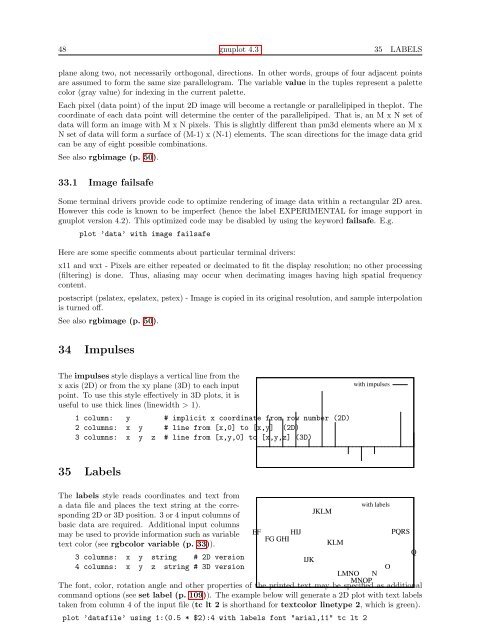
34 Impulses<br />
The impulses style displays a vertical line from the<br />
x axis (2D) or from the xy plane (3D) to each input<br />
point. To use this style effectively in 3D plots, it is<br />
useful to use thick lines (linewidth > 1).<br />
1 column: y # implicit x coordinate from row number (2D)<br />
2 columns: x y # line from [x,0] to [x,y] (2D)<br />
3 columns: x y z # line from [x,y,0] to [x,y,z] (3D)<br />
with impulses<br />
35 Labels<br />
The labels style reads coordinates and text from<br />
a data file and places the text string at the corresponding<br />
2D or 3D position. 3 or 4 input columns of<br />
basic data are required. Additional input columns<br />
may be used to provide information such as variable<br />
text color (see rgbcolor variable (p. 33)).<br />
3 columns: x y string # 2D version<br />
4 columns: x y z string # 3D version<br />
EF<br />
FG GHI<br />
HIJ<br />
IJK<br />
JKLM<br />
KLM<br />
with labels<br />
LMNO<br />
MNOP<br />
N<br />
O PQRS<br />
The font, color, rotation angle and other properties of the printed text may be specified as additional<br />
command options (see set label (p. 109)). The example below will generate a 2D plot with text labels<br />
taken from column 4 of the input file (tc lt 2 is shorthand for textcolor linetype 2, which is green).<br />
plot ’datafile’ using 1:(0.5 * $2):4 with labels font "arial,11" tc lt 2<br />
Q


