The Evolution of HTA in Emerging Markets Health-Care ... - TREE
The Evolution of HTA in Emerging Markets Health-Care ... - TREE
The Evolution of HTA in Emerging Markets Health-Care ... - TREE

You also want an ePaper? Increase the reach of your titles
YUMPU automatically turns print PDFs into web optimized ePapers that Google loves.
OHE Consult<strong>in</strong>g Report for PhRMA<br />
5 January 2011<br />
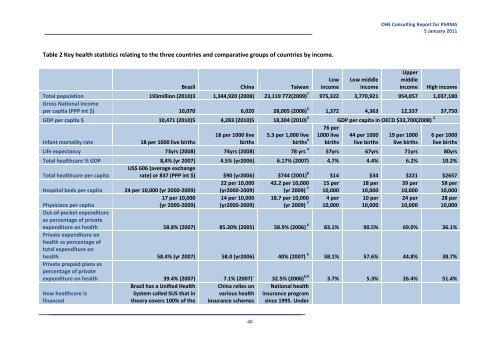
Table 2 Key health statistics relat<strong>in</strong>g to the three countries and comparative groups <strong>of</strong> countries by <strong>in</strong>come.<br />
Brazil Ch<strong>in</strong>a Taiwan<br />
Low<br />
<strong>in</strong>come<br />
Low middle<br />
<strong>in</strong>come<br />
Upper<br />
middle<br />
<strong>in</strong>come<br />
High <strong>in</strong>come<br />
Total population 193million (2010)3 1,344,920 (2008) 23,119 772(2009) 7 975,322 3,770,921 954,057 1,037,180<br />
Gross National <strong>in</strong>come<br />
per capita (PPP <strong>in</strong>t $) 10,070 6,020 28,005 (2006) 5 1,372 4,363 12,337 37,750<br />
GDP per capita $ 10,471 (2010)5 4,283 (2010)5 18,304 (2010) 5 GDP per capita <strong>in</strong> OECD $33,700(2008) 2<br />
Infant mortality rate<br />
18 per 1000 live births<br />
18 per 1000 live<br />
births<br />
5.3 per 1,000 live<br />
births 4<br />
76 per<br />
1000 live<br />
births<br />
44 per 1000<br />
live births<br />
19 per 1000<br />
live births<br />
6 per 1000<br />
live births<br />
Life expectancy 73yrs (2008) 74yrs (2008) 78 yrs 4 57yrs 67yrs 71yrs 80yrs<br />
Total healthcare % GDP 8,4% (yr 2007) 4.5% (yr2006) 6.17% (2007) 4.7% 4.4% 6.2% 10.2%<br />
Total healthcare per capita<br />
US$ 606 (average exchange<br />
rate) or 837 (PPP <strong>in</strong>t $) $90 (yr2006) $744 (2001) 8 $14 $34 $221 $2657<br />
Hospital beds per capita 24 per 10,000 (yr 2000-‐2009)<br />
22 per 10,000<br />
(yr2000-‐2009)<br />
42.2 per 10,000<br />
(yr 2009) 7<br />
15 per<br />
10,000<br />
18 per<br />
10,000<br />
39 per<br />
10,000<br />
58 per<br />
10,000<br />
Physicians per capita<br />
17 per 10,000<br />
(yr 2000-‐2009)<br />
14 per 10,000<br />
(yr2000-‐2009)<br />
18.7 per 10,000<br />
(yr 2009) 7<br />
4 per<br />
10,000<br />
10 per<br />
10,000<br />
24 per<br />
10,000<br />
28 per<br />
10,000<br />
Out-‐<strong>of</strong>-‐pocket expenditure<br />
as percentage <strong>of</strong> private<br />
expenditure on health 58.8% (2007) 85.30% (2005) 58.9% (2006) 6 83.1% 90.5% 69.0% 36.1%<br />
Private expenditure on<br />
health as percentage <strong>of</strong><br />
total expenditure on<br />
health 58.4% (yr 2007) 58.0 (yr2006) 40% (2007) 6 58.1% 57.6% 44.8% 38.7%<br />
Private prepaid plans as<br />
percentage <strong>of</strong> private<br />
expenditure on health 39.4% (2007) 7.1% (2007)` 32.5% (2006) 6,9 3.7% 5.3% 26.4% 51.4%<br />
How healthcare is<br />
f<strong>in</strong>anced<br />
Brazil has a Unified <strong>Health</strong><br />
System called SUS that <strong>in</strong><br />
theory covers 100% <strong>of</strong> the<br />
Ch<strong>in</strong>a relies on<br />
various health<br />
<strong>in</strong>surance schemes<br />
National health<br />
<strong>in</strong>surance program<br />
s<strong>in</strong>ce 1995. Under<br />
48