The Price of Illicit Drugs: 1981 through the - The White House
The Price of Illicit Drugs: 1981 through the - The White House
The Price of Illicit Drugs: 1981 through the - The White House

Create successful ePaper yourself
Turn your PDF publications into a flip-book with our unique Google optimized e-Paper software.
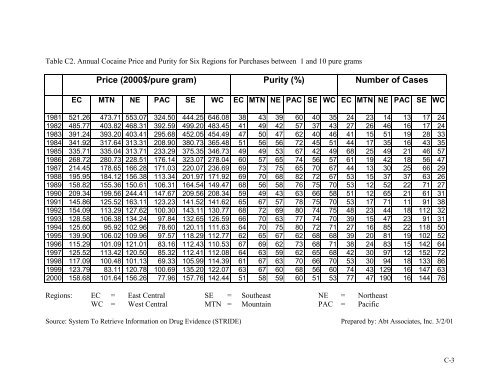
Table C2. Annual Cocaine <strong>Price</strong> and Purity for Six Regions for Purchases between 1 and 10 pure grams<br />
<strong>Price</strong> (2000$/pure gram) Purity (%) Number <strong>of</strong> Cases<br />
EC MTN NE PAC SE WC EC MTN NE PAC SE WC EC MTN NE PAC SE WC<br />
<strong>1981</strong> 521.26 473.71 553.07 324.50 444.25 646.08 38 43 39 60 40 35 24 23 14 13 17 24<br />
1982 485.77 403.82 468.31 392.59 499.20 483.45 41 49 42 57 37 43 27 26 46 16 17 24<br />
1983 391.24 393.20 403.41 295.68 452.05 454.49 47 50 47 62 40 46 41 15 51 19 28 33<br />
1984 341.92 317.64 313.31 208.90 380.73 365.48 51 56 56 72 45 51 44 17 35 16 43 35<br />
1985 335.71 335.04 313.71 233.29 375.35 346.73 49 49 53 67 42 49 68 25 49 21 46 57<br />
1986 268.72 280.73 228.51 176.14 323.07 278.04 60 57 65 74 56 57 61 19 42 18 56 47<br />
1987 214.45 178.65 166.28 171.03 220.07 236.69 69 73 75 65 70 67 44 13 30 25 66 29<br />
1988 195.95 184.12 156.38 113.34 201.97 171.92 69 70 68 82 72 67 53 15 37 37 63 26<br />
1989 158.82 155.36 150.61 106.31 164.54 149.47 68 56 58 76 75 70 53 12 52 22 71 27<br />
1990 209.34 199.56 244.41 147.67 209.56 208.34 59 49 43 63 66 58 51 12 65 21 61 31<br />
1991 145.86 125.52 163.11 123.23 141.52 141.62 65 67 57 78 75 70 53 17 71 11 91 38<br />
1992 154.09 113.29 127.62 100.30 143.11 130.77 68 72 69 80 74 75 48 23 44 18 112 32<br />
1993 128.58 106.38 134.24 97.84 132.65 126.59 66 70 63 77 74 70 39 15 47 23 91 31<br />
1994 125.60 95.92 102.96 78.60 120.11 111.63 64 70 75 80 72 71 27 16 85 22 118 50<br />
1995 139.90 106.02 109.96 97.57 118.29 112.77 62 65 67 62 68 68 39 20 81 19 102 52<br />
1996 115.29 101.09 121.01 83.16 112.43 110.53 67 69 62 73 68 71 38 24 83 15 142 64<br />
1997 125.52 113.42 120.50 85.32 112.41 112.08 64 63 59 62 65 68 42 30 97 12 152 72<br />
1998 117.09 100.48 101.13 69.33 105.99 114.39 61 67 63 70 66 70 53 30 94 18 133 86<br />
1999 123.79 83.11 120.78 100.69 135.20 122.07 63 67 60 68 56 60 74 43 129 16 147 63<br />
2000 158.68 101.64 156.26 77.96 157.76 142.44 51 58 59 60 51 53 77 47 190 16 144 76<br />
Regions: EC = East Central SE = Sou<strong>the</strong>ast NE = Nor<strong>the</strong>ast<br />
WC = West Central MTN = Mountain PAC = Pacific<br />
Source: System To Retrieve Information on Drug Evidence (STRIDE) Prepared by: Abt Associates, Inc. 3/2/01<br />
C-3