The Price of Illicit Drugs: 1981 through the - The White House
The Price of Illicit Drugs: 1981 through the - The White House
The Price of Illicit Drugs: 1981 through the - The White House

Create successful ePaper yourself
Turn your PDF publications into a flip-book with our unique Google optimized e-Paper software.
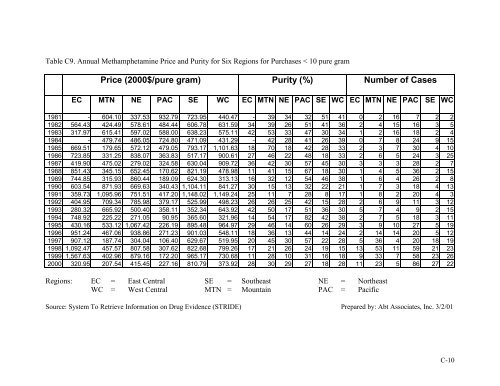
Table C9. Annual Methamphetamine <strong>Price</strong> and Purity for Six Regions for Purchases < 10 pure gram<br />
<strong>Price</strong> (2000$/pure gram) Purity (%) Number <strong>of</strong> Cases<br />
EC MTN NE PAC SE WC EC MTN NE PAC SE WC EC MTN NE PAC SE WC<br />
<strong>1981</strong> - 604.10 337.53 932.79 723.95 440.47 - 39 34 32 51 41 0 2 16 7 2 2<br />
1982 564.43 424.49 578.61 484.44 606.78 631.59 34 39 26 51 41 36 2 4 15 16 3 5<br />
1983 317.97 615.41 597.02 588.00 638.23 575.11 42 53 33 47 30 34 1 2 16 18 2 4<br />
1984 - 479.74 486.05 724.80 471.09 431.29 - 42 28 41 26 39 0 7 8 24 9 15<br />
1985 669.51 179.65 572.12 479.05 793.17 1,101.63 18 70 18 42 28 33 2 3 7 30 4 10<br />
1986 723.85 331.25 838.07 363.83 517.17 900.61 27 46 22 48 18 33 2 6 5 24 3 25<br />
1987 419.90 475.02 279.02 324.58 630.04 909.72 36 42 30 57 45 30 3 3 3 28 2 7<br />
1988 851.43 345.15 652.45 170.62 821.19 478.98 11 41 15 67 18 30 1 4 5 36 2 15<br />
1989 744.85 315.93 860.44 189.09 624.30 313.13 16 32 12 54 46 38 1 6 4 26 2 8<br />
1990 603.54 871.93 669.63 340.43 1,104.11 841.27 30 15 13 32 22 21 1 7 3 18 4 13<br />
1991 359.73 1,095.96 751.51 417.20 1,148.02 1,149.24 25 11 7 28 8 17 1 8 2 20 4 3<br />
1992 404.95 709.34 785.98 379.17 525.99 498.23 26 26 25 42 15 28 2 6 9 11 3 12<br />
1993 280.32 665.92 500.40 358.11 352.34 643.92 42 50 17 51 36 30 5 7 4 9 2 15<br />
1994 748.92 225.22 271.05 90.95 365.60 321.96 14 54 17 82 42 38 2 7 5 18 3 11<br />
1995 430.16 533.12 1,067.42 226.19 895.48 964.97 29 46 14 60 26 29 3 9 10 27 5 19<br />
1996 951.24 467.06 938.86 271.23 901.03 548.11 18 36 13 44 14 24 2 14 14 20 5 12<br />
1997 907.12 187.74 304.04 106.40 629.67 519.95 20 45 30 57 22 28 5 36 4 20 18 19<br />
1998 1,092.47 457.57 807.58 307.62 822.68 799.26 17 21 26 24 19 15 13 53 11 59 21 23<br />
1999 1,567.63 402.96 879.16 172.20 965.17 730.68 11 28 10 31 16 18 9 33 7 58 23 26<br />
2000 320.95 207.54 415.45 227.16 810.79 373.92 28 30 29 27 18 28 11 23 5 86 27 22<br />
Regions: EC = East Central SE = Sou<strong>the</strong>ast NE = Nor<strong>the</strong>ast<br />
WC = West Central MTN = Mountain PAC = Pacific<br />
Source: System To Retrieve Information on Drug Evidence (STRIDE) Prepared by: Abt Associates, Inc. 3/2/01<br />
C-10