The Price of Illicit Drugs: 1981 through the - The White House
The Price of Illicit Drugs: 1981 through the - The White House
The Price of Illicit Drugs: 1981 through the - The White House

Create successful ePaper yourself
Turn your PDF publications into a flip-book with our unique Google optimized e-Paper software.
normal, and <strong>the</strong>y are also optimal among a large class <strong>of</strong> estimators (McCullagh and Nelder, 1989,<br />
ch. 9). Residual analysis supported <strong>the</strong> adequacy <strong>of</strong> <strong>the</strong> specifications given by (1) and (2),<br />
although consistency and asymptotic normality hold even when <strong>the</strong> variance function is<br />
incorrectly specified (Fahrmeir and Tutz, 1994, pp.52-55).<br />
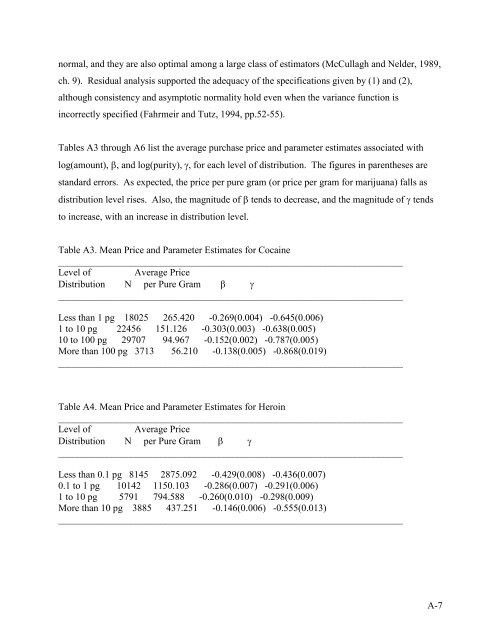
Tables A3 <strong>through</strong> A6 list <strong>the</strong> average purchase price and parameter estimates associated with<br />
log(amount), , and log(purity), , for each level <strong>of</strong> distribution. <strong>The</strong> figures in paren<strong>the</strong>ses are<br />
standard errors. As expected, <strong>the</strong> price per pure gram (or price per gram for marijuana) falls as<br />
distribution level rises. Also, <strong>the</strong> magnitude <strong>of</strong> tends to decrease, and <strong>the</strong> magnitude <strong>of</strong> tends<br />
to increase, with an increase in distribution level.<br />
Table A3. Mean <strong>Price</strong> and Parameter Estimates for Cocaine<br />
_______________________________________________________________________<br />
Level <strong>of</strong> Average <strong>Price</strong><br />
Distribution N per Pure Gram <br />
_______________________________________________________________________<br />
Less than 1 pg 18025 265.420 -0.269(0.004) -0.645(0.006)<br />
1 to 10 pg 22456 151.126 -0.303(0.003) -0.638(0.005)<br />
10 to 100 pg 29707 94.967 -0.152(0.002) -0.787(0.005)<br />
More than 100 pg 3713 56.210 -0.138(0.005) -0.868(0.019)<br />
_______________________________________________________________________<br />
Table A4. Mean <strong>Price</strong> and Parameter Estimates for Heroin<br />
_______________________________________________________________________<br />
Level <strong>of</strong> Average <strong>Price</strong><br />
Distribution N per Pure Gram <br />
_______________________________________________________________________<br />
Less than 0.1 pg 8145 2875.092 -0.429(0.008) -0.436(0.007)<br />
0.1 to 1 pg 10142 1150.103 -0.286(0.007) -0.291(0.006)<br />
1 to 10 pg 5791 794.588 -0.260(0.010) -0.298(0.009)<br />
More than 10 pg 3885 437.251 -0.146(0.006) -0.555(0.013)<br />
_______________________________________________________________________<br />
A-7