The Price of Illicit Drugs: 1981 through the - The White House
The Price of Illicit Drugs: 1981 through the - The White House
The Price of Illicit Drugs: 1981 through the - The White House

Create successful ePaper yourself
Turn your PDF publications into a flip-book with our unique Google optimized e-Paper software.
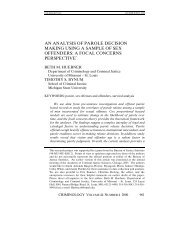
Figure A4. Predicted Weights for Cocaine: Cocaine, <strong>1981</strong>-Q1 to 2000-Q2<br />
We fit a Poisson regression model (E(y t ) = exp( + time t ) and V(y t ) = E(y t ), where y t =<br />
emergency-events at time t) to <strong>the</strong> resulting “extended” DAWN database (18 semi-annual<br />
emergency-event counts from 1988 <strong>through</strong> 1999 for 29 cities plus <strong>the</strong> Rest <strong>of</strong> U.S.) to obtain<br />
modeled counts for <strong>the</strong> 78 quarters from Q1 <strong>1981</strong> <strong>through</strong> Q2 2000 for each city. <strong>The</strong> modeled<br />
weights were <strong>the</strong>n calculated from <strong>the</strong> modeled counts in such a way that <strong>the</strong> weights in a given<br />
quarter summed to one. For example, Figure A4 shows <strong>the</strong> modeled and observed weights for<br />
Chicago.<br />
Modeling <strong>the</strong> weights achieved two objectives. Firstly, it smoo<strong>the</strong>d over <strong>the</strong> random fluctuations<br />
in quarters where data existed, and secondly, it provided estimates (extrapolations and<br />
interpolations) in quarters where data was unavailable. Overall <strong>the</strong> modeled weights appeared<br />
A-16