The Price of Illicit Drugs: 1981 through the - The White House
The Price of Illicit Drugs: 1981 through the - The White House
The Price of Illicit Drugs: 1981 through the - The White House

You also want an ePaper? Increase the reach of your titles
YUMPU automatically turns print PDFs into web optimized ePapers that Google loves.
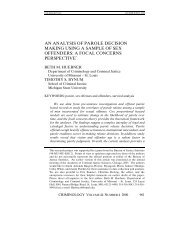
Table B3: Estimated DAWN Weights for Methamphetamine<br />
(Continued)<br />
Metropolitan Area 1993 1994 1995<br />
Q1 Q2 Q3 Q4 Q1 Q2 Q3 Q4 Q1 Q2 Q3 Q4<br />
Atlanta 0.008 0.008 0.009 0.009 0.009 0.009 0.009 0.009 0.009 0.009 0.009 0.010<br />
Baltimore 0.001 0.001 0.001 0.001 0.001 0.001 0.001 0.001 0.001 0.001 0.001 0.001<br />
Boston 0.001 0.001 0.001 0.001 0.001 0.001 0.001 0.001 0.001 0.001 0.001 0.001<br />
Buffalo 0.001 0.001 0.001 0.001 0.001 0.001 0.001 0.001 0.001 0.001 0.001 0.001<br />
Chicago 0.003 0.003 0.003 0.003 0.003 0.003 0.002 0.002 0.002 0.002 0.002 0.002<br />
Cleveland 0.001 0.001 0.001 0.001 0.001 0.001 0.001 0.000 0.000 0.000 0.000 0.000<br />
Dallas 0.018 0.018 0.017 0.016 0.016 0.015 0.014 0.014 0.013 0.013 0.012 0.012<br />
Denver 0.010 0.010 0.011 0.011 0.011 0.011 0.011 0.011 0.011 0.011 0.011 0.011<br />
Detroit 0.002 0.001 0.001 0.001 0.001 0.001 0.001 0.001 0.001 0.001 0.001 0.001<br />
Houston 0.023 0.022 0.021 0.020 0.019 0.019 0.018 0.017 0.017 0.016 0.015 0.015<br />
Kansas City 0.003 0.003 0.003 0.003 0.003 0.003 0.003 0.003 0.003 0.003 0.003 0.003<br />
Los Angeles 0.087 0.087 0.087 0.087 0.087 0.087 0.087 0.087 0.087 0.087 0.087 0.087<br />
Miami 0.001 0.001 0.001 0.001 0.001 0.001 0.001 0.001 0.001 0.001 0.001 0.001<br />
Milwaukee 0.004 0.004 0.004 0.004 0.004 0.004 0.004 0.004 0.004 0.004 0.004 0.004<br />
Minneapolis-St Paul 0.007 0.007 0.008 0.008 0.008 0.008 0.008 0.008 0.008 0.008 0.008 0.008<br />
New Orleans 0.002 0.002 0.002 0.002 0.002 0.002 0.002 0.002 0.002 0.002 0.002 0.002<br />
New York 0.002 0.002 0.002 0.002 0.002 0.002 0.002 0.002 0.002 0.002 0.002 0.002<br />
Newark 0.000 0.000 0.000 0.000 0.000 0.000 0.000 0.000 0.000 0.000 0.000 0.000<br />
Philadelphia 0.011 0.010 0.010 0.010 0.009 0.009 0.008 0.008 0.008 0.007 0.007 0.007<br />
Phoenix 0.046 0.046 0.046 0.046 0.046 0.046 0.046 0.046 0.046 0.046 0.046 0.046<br />
Pittsburgh 0.001 0.001 0.001 0.001 0.001 0.001 0.001 0.001 0.001 0.001 0.001 0.001<br />
Portland 0.015 0.015 0.015 0.015 0.015 0.016 0.016 0.016 0.016 0.017 0.017 0.017<br />
San Antonio 0.009 0.009 0.008 0.008 0.008 0.007 0.007 0.007 0.007 0.006 0.006 0.006<br />
San Diego 0.088 0.086 0.084 0.081 0.079 0.077 0.075 0.073 0.071 0.069 0.068 0.066<br />
San Francisco 0.090 0.089 0.087 0.086 0.084 0.083 0.081 0.080 0.078 0.077 0.076 0.074<br />
Seattle 0.019 0.019 0.020 0.020 0.020 0.020 0.021 0.021 0.021 0.021 0.022 0.022<br />
St Louis 0.005 0.005 0.005 0.005 0.005 0.005 0.005 0.005 0.005 0.005 0.005 0.005<br />
Tampa 0.001 0.001 0.001 0.001 0.001 0.001 0.001 0.001 0.001 0.001 0.001 0.001<br />
Washington, DC 0.002 0.002 0.002 0.002 0.002 0.002 0.002 0.002 0.002 0.002 0.002 0.002<br />
Rest <strong>of</strong> US 0.539 0.545 0.550 0.555 0.560 0.565 0.570 0.575 0.580 0.585 0.590 0.594<br />
Source: Drug Abuse Warning Network Emergency Room Mentions, 1988 – 1999.<br />
B-20