The Price of Illicit Drugs: 1981 through the - The White House
The Price of Illicit Drugs: 1981 through the - The White House
The Price of Illicit Drugs: 1981 through the - The White House

You also want an ePaper? Increase the reach of your titles
YUMPU automatically turns print PDFs into web optimized ePapers that Google loves.
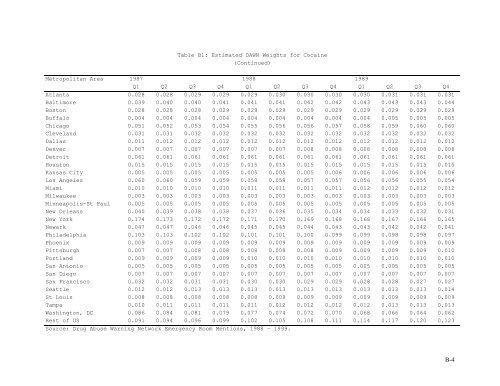
Table B1: Estimated DAWN Weights for Cocaine<br />
(Continued)<br />
Metropolitan Area 1987 1988 1989<br />
Q1 Q2 Q3 Q4 Q1 Q2 Q3 Q4 Q1 Q2 Q3 Q4<br />
Atlanta 0.028 0.028 0.029 0.029 0.029 0.030 0.030 0.030 0.030 0.031 0.031 0.031<br />
Baltimore 0.039 0.040 0.040 0.041 0.041 0.041 0.042 0.042 0.043 0.043 0.043 0.044<br />
Boston 0.028 0.028 0.028 0.029 0.029 0.029 0.029 0.029 0.029 0.029 0.029 0.029<br />
Buffalo 0.004 0.004 0.004 0.004 0.004 0.004 0.004 0.004 0.004 0.005 0.005 0.005<br />
Chicago 0.051 0.052 0.053 0.054 0.055 0.056 0.056 0.057 0.058 0.059 0.060 0.060<br />
Cleveland 0.031 0.031 0.032 0.032 0.032 0.032 0.032 0.032 0.032 0.032 0.032 0.032<br />
Dallas 0.011 0.012 0.012 0.012 0.012 0.012 0.012 0.012 0.012 0.012 0.012 0.012<br />
Denver 0.007 0.007 0.007 0.007 0.007 0.007 0.008 0.008 0.008 0.008 0.008 0.008<br />
Detroit 0.061 0.061 0.061 0.061 0.061 0.061 0.061 0.061 0.061 0.061 0.061 0.061<br />
Houston 0.015 0.015 0.015 0.015 0.015 0.015 0.015 0.015 0.015 0.015 0.015 0.015<br />
Kansas City 0.005 0.005 0.005 0.005 0.005 0.005 0.005 0.006 0.006 0.006 0.006 0.006<br />
Los Angeles 0.060 0.060 0.059 0.059 0.058 0.058 0.057 0.057 0.056 0.056 0.055 0.054<br />
Miami 0.010 0.010 0.010 0.010 0.011 0.011 0.011 0.011 0.012 0.012 0.012 0.012<br />
Milwaukee 0.003 0.003 0.003 0.003 0.003 0.003 0.003 0.003 0.003 0.003 0.003 0.003<br />
Minneapolis-St Paul 0.005 0.005 0.005 0.005 0.005 0.005 0.005 0.005 0.005 0.005 0.005 0.005<br />
New Orleans 0.040 0.039 0.038 0.038 0.037 0.036 0.035 0.034 0.034 0.033 0.032 0.031<br />
New York 0.174 0.173 0.172 0.172 0.171 0.170 0.169 0.168 0.168 0.167 0.166 0.165<br />
Newark 0.047 0.047 0.046 0.046 0.045 0.045 0.044 0.043 0.043 0.042 0.042 0.041<br />
Philadelphia 0.103 0.103 0.102 0.102 0.101 0.101 0.100 0.099 0.099 0.098 0.098 0.097<br />
Phoenix 0.009 0.009 0.009 0.009 0.009 0.009 0.009 0.009 0.009 0.009 0.009 0.009<br />
Pittsburgh 0.007 0.007 0.008 0.008 0.008 0.008 0.008 0.009 0.009 0.009 0.009 0.010<br />
Portland 0.009 0.009 0.009 0.009 0.010 0.010 0.010 0.010 0.010 0.010 0.010 0.010<br />
San Antonio 0.005 0.005 0.005 0.005 0.005 0.005 0.005 0.005 0.005 0.005 0.005 0.005<br />
San Diego 0.007 0.007 0.007 0.007 0.007 0.007 0.007 0.007 0.007 0.007 0.007 0.007<br />
San Francisco 0.032 0.032 0.031 0.031 0.030 0.030 0.029 0.029 0.028 0.028 0.027 0.027<br />
Seattle 0.012 0.012 0.013 0.013 0.013 0.013 0.013 0.013 0.013 0.013 0.013 0.014<br />
St Louis 0.008 0.008 0.008 0.008 0.008 0.009 0.009 0.009 0.009 0.009 0.009 0.009<br />
Tampa 0.010 0.011 0.011 0.011 0.011 0.012 0.012 0.012 0.012 0.013 0.013 0.013<br />
Washington, DC 0.086 0.084 0.081 0.079 0.077 0.074 0.072 0.070 0.068 0.066 0.064 0.062<br />
Rest <strong>of</strong> US 0.091 0.094 0.096 0.099 0.102 0.105 0.108 0.111 0.114 0.117 0.120 0.123<br />
Source: Drug Abuse Warning Network Emergency Room Mentions, 1988 – 1999.<br />
B-4