annual report/2006 - University of Melbourne
annual report/2006 - University of Melbourne
annual report/2006 - University of Melbourne

You also want an ePaper? Increase the reach of your titles
YUMPU automatically turns print PDFs into web optimized ePapers that Google loves.
introduction<br />
and overview/<br />
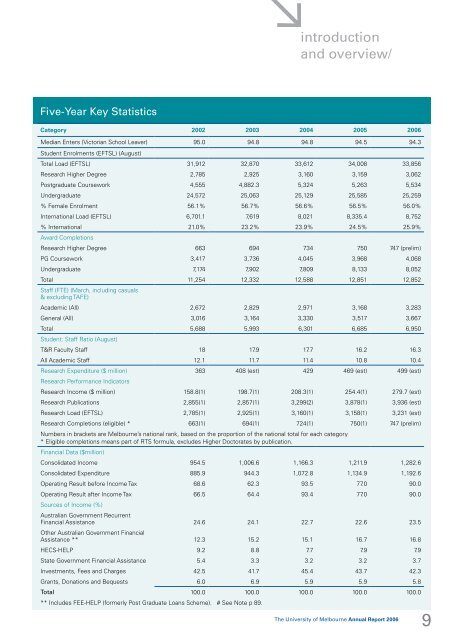
Five-Year Key Statistics<br />
Category 2002 2003 2004 2005 <strong>2006</strong><br />
Median Enters (Victorian School Leaver) 95.0 94.8 94.8 94.5 94.3<br />
Student Enrolments (EFTSL) (August)<br />
Total Load (EFTSL) 31,912 32,870 33,612 34,008 33,856<br />
Research Higher Degree 2,785 2,925 3,160 3,159 3,062<br />
Postgraduate Coursework 4,555 4,882.3 5,324 5,263 5,534<br />
Undergraduate 24,572 25,063 25,129 25,585 25,259<br />
% Female Enrolment 56.1% 56.7% 56.6% 56.5% 56.0%<br />
International Load (EFTSL) 6,701.1 7,619 8,021 8,335.4 8,752<br />
% International 21.0% 23.2% 23.9% 24.5% 25.9%<br />
Award Completions<br />
Research Higher Degree 663 694 734 750 747 (prelim)<br />
PG Coursework 3,417 3,736 4,045 3,968 4,068<br />
Undergraduate 7,174 7,902 7,809 8,133 8,052<br />
Total 11,254 12,332 12,588 12,851 12,852<br />
Staff (FTE) (March, including casuals<br />
& excluding TAFE)<br />
Academic (All) 2,672 2,829 2,971 3,168 3,283<br />
General (All) 3,016 3,164 3,330 3,517 3,667<br />
Total 5,688 5,993 6,301 6,685 6,950<br />
Student: Staff Ratio (August)<br />
T&R Faculty Staff 18 17.9 17.7 16.2 16.3<br />
All Academic Staff 12.1 11.7 11.4 10.8 10.4<br />
Research Expenditure ($ million) 363 408 (est) 429 469 (est) 499 (est)<br />
Research Performance Indicators<br />
Research Income ($ million) 158.8(1) 198.7(1) 208.3(1) 254.4(1) 279.7 (est)<br />
Research Publications 2,855(1) 2,857(1) 3,299(2) 3,878(1) 3,936 (est)<br />
Research Load (EFTSL) 2,785(1) 2,925(1) 3,160(1) 3,158(1) 3,231 (est)<br />
Research Completions (eligible) * 663(1) 694(1) 724(1) 750(1) 747 (prelim)<br />
Numbers in brackets are <strong>Melbourne</strong>’s national rank, based on the proportion <strong>of</strong> the national total for each category<br />
* Eligible completions means part <strong>of</strong> RTS formula, excludes Higher Doctorates by publication.<br />
Financial Data ($million)<br />
Consolidated Income 954.5 1,006.6 1,166.3 1,211.9 1,282.6<br />
Consolidated Expenditure 885.9 944.3 1,072.8 1,134.9 1,192.6<br />
Operating Result before Income Tax 68.6 62.3 93.5 77.0 90.0<br />
Operating Result after Income Tax 66.5 64.4 93.4 77.0 90.0<br />
Sources <strong>of</strong> Income (%)<br />
Australian Government Recurrent<br />
Financial Assistance 24.6 24.1 22.7 22.6 23.5<br />
Other Australian Government Financial<br />
Assistance ** 12.3 15.2 15.1 16.7 16.8<br />
HECS-HELP 9.2 8.8 7.7 7.9 7.9<br />
State Government Financial Assistance 5.4 3.3 3.2 3.2 3.7<br />
Investments, Fees and Charges 42.5 41.7 45.4 43.7 42.3<br />
Grants, Donations and Bequests 6.0 6.9 5.9 5.9 5.8<br />
Total 100.0 100.0 100.0 100.0 100.0<br />
** Includes FEE-HELP (formerly Post Graduate Loans Scheme). # See Note p 89.<br />
The <strong>University</strong> <strong>of</strong> <strong>Melbourne</strong> Annual Report <strong>2006</strong>