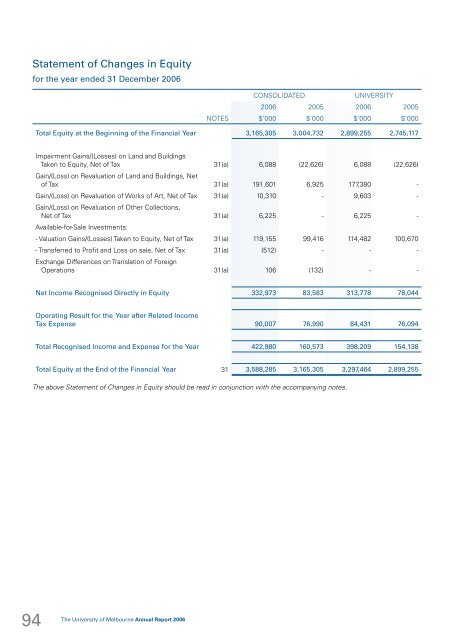
Statement <strong>of</strong> Changes in Equity for the year ended 31 December <strong>2006</strong> CONSOLIDATED UNIVERSITY <strong>2006</strong> 2005 <strong>2006</strong> 2005 NOTES $’000 $’000 $’000 $’000 Total Equity at the Beginning <strong>of</strong> the Financial Year 3,165,305 3,004,732 2,899,255 2,745,117 Impairment Gains/(Losses) on Land and Buildings Taken to Equity, Net <strong>of</strong> Tax 31(a) 6,088 (22,626) 6,088 (22,626) Gain/(Loss) on Revaluation <strong>of</strong> Land and Buildings, Net <strong>of</strong> Tax 31(a) 191,601 6,925 177,380 - Gain/(Loss) on Revaluation <strong>of</strong> Works <strong>of</strong> Art, Net <strong>of</strong> Tax 31(a) 10,310 - 9,603 - Gain/(Loss) on Revaluation <strong>of</strong> Other Collections, Net <strong>of</strong> Tax 31(a) 6,225 - 6,225 - Available-for-Sale Investments: - Valuation Gains/(Losses) Taken to Equity, Net <strong>of</strong> Tax 31(a) 119,155 99,416 114,482 100,670 - Transferred to Pr<strong>of</strong>it and Loss on sale, Net <strong>of</strong> Tax 31(a) (512) - - - Exchange Differences on Translation <strong>of</strong> Foreign Operations 31(a) 106 (132) - - Net Income Recognised Directly in Equity 332,973 83,583 313,778 78,044 Operating Result for the Year after Related Income Tax Expense 90,007 76,990 84,431 76,094 Total Recognised Income and Expense for the Year 422,980 160,573 398,209 154,138 Total Equity at the End <strong>of</strong> the Financial Year 31 3,588,285 3,165,305 3,297,464 2,899,255 The above Statement <strong>of</strong> Changes in Equity should be read in conjunction with the accompanying notes. 94 The <strong>University</strong> <strong>of</strong> <strong>Melbourne</strong> Annual Report <strong>2006</strong>
financial statements/ Cash Flow Statement for the year ended 31 December <strong>2006</strong> Cash Flows from Operating Activities - CONSOLIDATED UNIVERSITY <strong>2006</strong> 2005 <strong>2006</strong> 2005 NOTES $’000 $’000 $’000 $’000 Inflows: Australian Government - - CGS, Research and Other DEST Grants 509,998 460,403 510,206 460,403 - Higher Education Loan Programmes 103,826 94,565 102,731 93,730 - Other Australian Government Grants 4,061 4,399 731 1,278 State Government Grants 30,098 29,645 29,724 29,528 HECS-HELP - Student Payments 25,272 24,703 24,372 24,316 Dividends Received 96,831 82,010 93,560 77,443 Interest Received 18,259 18,014 15,040 14,165 Fee-for-Service Revenue 337,347 341,039 266,301 255,064 Other Income 134,243 163,203 120,098 148,703 Outflows: Payments to Employees (627,914) (592,200) (564,024) (529,735) Payments to Suppliers (inclusive <strong>of</strong> Goods and Services Tax (GST)) (307,344) (302,900) (265,571) (240,548) Interest Paid (10,860) (10,692) (10,767) (10,610) GST - Net Payment to Australian Taxation Office (5,992) (5,423) (5,101) (4,326) Other Outflows (134,913) (109,329) (152,460) (124,828) Net Cash Inflow (Outflow) from Operating Activities 45(b) 172,912 197,437 164,840 194,585 Cash Flows from Investing Activities - Inflows: Proceeds from Sale <strong>of</strong> Property, Plant and Equipment 2,218 2,223 1,412 2,030 Proceeds from Sale <strong>of</strong> Available-for-Sale and Other Investments 855,941 1,203,283 800,420 1,145,578 Outflows: Purchase <strong>of</strong> Property, Plant and Equipment (90,020) (87,589) (84,773) (81,208) Purchase <strong>of</strong> Available-for-Sale and Other Investments (942,236) (1,285,135) (895,239) (1,231,033) Purchase <strong>of</strong> Intangible Assets (129) - (32) - Net Cash Inflow (Outflow) from Investing Activities (174,226) (167,218) (178,212) (164,633) Cash Flows from Financing Activities - Inflows: Loans Repaid 1,040 1,447 2,290 1,547 Other Inflows 25 - - - Outflows: Loans Granted (802) (1,694) (802) (1,694) Repayment <strong>of</strong> Interest Bearing Liabilities (3,196) (2,148) (2,448) (2,148) Net Cash Inflow (Outflow) from Financing Activities (2,933) (2,395) (960) (2,295) Net Increase/(Decrease) in Cash and Cash Equivalents (4,247) 27,824 (14,332) 27,656 Cash and Cash Equivalents at the Beginning <strong>of</strong> the Year 72,576 44,803 50,826 23,170 Effect <strong>of</strong> Foreign Exchange Rate on Cash and Cash Equivalents 106 (51) - - Cash and Cash Equivalents at the End <strong>of</strong> the Year 45(a) 68,435 72,576 36,494 50,826 The <strong>University</strong> <strong>of</strong> <strong>Melbourne</strong> Annual Report <strong>2006</strong> 95