CERFACS CERFACS Scientific Activity Report Jan. 2010 â Dec. 2011
CERFACS CERFACS Scientific Activity Report Jan. 2010 â Dec. 2011
CERFACS CERFACS Scientific Activity Report Jan. 2010 â Dec. 2011
You also want an ePaper? Increase the reach of your titles
YUMPU automatically turns print PDFs into web optimized ePapers that Google loves.
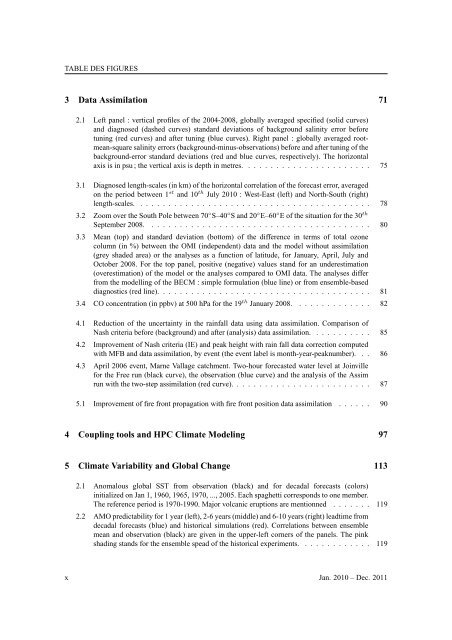
TABLE DES FIGURES<br />
3 Data Assimilation 71<br />
2.1 Left panel : vertical profiles of the 2004-2008, globally averaged specified (solid curves)<br />
and diagnosed (dashed curves) standard deviations of background salinity error before<br />
tuning (red curves) and after tuning (blue curves). Right panel : globally averaged rootmean-square<br />
salinity errors (background-minus-observations) before and after tuning of the<br />
background-error standard deviations (red and blue curves, respectively). The horizontal<br />
axis is in psu ; the vertical axis is depth in metres. . . . . . . . . . . . . . . . . . . . . . . 75<br />
3.1 Diagnosed length-scales (in km) of the horizontal correlation of the forecast error, averaged<br />
on the period between 1 st and 10 th July <strong>2010</strong> : West-East (left) and North-South (right)<br />
length-scales. . . . . . . . . . . . . . . . . . . . . . . . . . . . . . . . . . . . . . . . . . 78<br />
3.2 Zoom over the South Pole between 70 ◦ S–40 ◦ S and 20 ◦ E–60 ◦ E of the situation for the 30 th<br />
September 2008. . . . . . . . . . . . . . . . . . . . . . . . . . . . . . . . . . . . . . . . 80<br />
3.3 Mean (top) and standard deviation (bottom) of the difference in terms of total ozone<br />
column (in %) between the OMI (independent) data and the model without assimilation<br />
(grey shaded area) or the analyses as a function of latitude, for <strong>Jan</strong>uary, April, July and<br />
October 2008. For the top panel, positive (negative) values stand for an underestimation<br />
(overestimation) of the model or the analyses compared to OMI data. The analyses differ<br />
from the modelling of the BECM : simple formulation (blue line) or from ensemble-based<br />
diagnostics (red line). . . . . . . . . . . . . . . . . . . . . . . . . . . . . . . . . . . . . . 81<br />
3.4 CO concentration (in ppbv) at 500 hPa for the 19 th <strong>Jan</strong>uary 2008. . . . . . . . . . . . . . 82<br />
4.1 Reduction of the uncertainty in the rainfall data using data assimilation. Comparison of<br />
Nash criteria before (background) and after (analysis) data assimilation. . . . . . . . . . . 85<br />
4.2 Improvement of Nash criteria (IE) and peak height with rain fall data correction computed<br />
with MFB and data assimilation, by event (the event label is month-year-peaknumber). . . 86<br />
4.3 April 2006 event, Marne Vallage catchment. Two-hour forecasted water level at Joinville<br />
for the Free run (black curve), the observation (blue curve) and the analysis of the Assim<br />
run with the two-step assimilation (red curve). . . . . . . . . . . . . . . . . . . . . . . . . 87<br />
5.1 Improvement of fire front propagation with fire front position data assimilation . . . . . . 90<br />
4 Coupling tools and HPC Climate Modeling 97<br />
5 Climate Variability and Global Change 113<br />
2.1 Anomalous global SST from observation (black) and for decadal forecasts (colors)<br />
initialized on <strong>Jan</strong> 1, 1960, 1965, 1970, ..., 2005. Each spaghetti corresponds to one member.<br />
The reference period is 1970-1990. Major volcanic eruptions are mentionned . . . . . . . 119<br />
2.2 AMO predictability for 1 year (left), 2-6 years (middle) and 6-10 years (right) leadtime from<br />
decadal forecasts (blue) and historical simulations (red). Correlations between ensemble<br />
mean and observation (black) are given in the upper-left corners of the panels. The pink<br />
shading stands for the ensemble spead of the historical experiments. . . . . . . . . . . . . 119<br />
x <strong>Jan</strong>. <strong>2010</strong> – <strong>Dec</strong>. <strong>2011</strong>


