
You also want an ePaper? Increase the reach of your titles
YUMPU automatically turns print PDFs into web optimized ePapers that Google loves.
Socio-economic functions of forest resources 137<br />
Status<br />
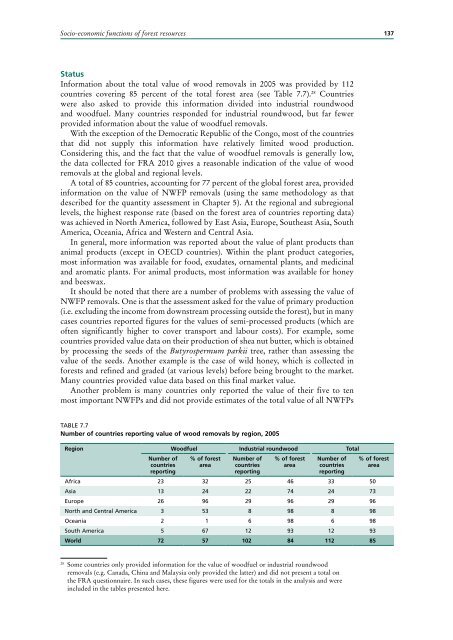
Information about the total value of wood removals in 2005 was provided by 112<br />
countries covering 85 percent of the total forest area (see Table 7.7). 28 Countries<br />
were also asked to provide this information divided into industrial roundwood<br />
and woodfuel. Many countries responded for industrial roundwood, but far fewer<br />
provided information about the value of woodfuel removals.<br />
With the exception of the Democratic Republic of the Congo, most of the countries<br />
that did not supply this information have relatively limited wood production.<br />
Considering this, and the fact that the value of woodfuel removals is generally low,<br />
the data collected for FRA <strong>2010</strong> gives a reasonable indication of the value of wood<br />
removals at the global and regional levels.<br />
A total of 85 countries, accounting for 77 percent of the global forest area, provided<br />
information on the value of NWFP removals (using the same methodology as that<br />
described for the quantity assessment in Chapter 5). At the regional and subregional<br />
levels, the highest response rate (based on the forest area of countries reporting data)<br />
was achieved in North America, followed by East Asia, Europe, Southeast Asia, South<br />
America, Oceania, Africa and Western and Central Asia.<br />
In general, more information was reported about the value of plant products than<br />
animal products (except in OECD countries). Within the plant product categories,<br />
most information was available for food, exudates, ornamental plants, and medicinal<br />
and aromatic plants. For animal products, most information was available for honey<br />
and beeswax.<br />
It should be noted that there are a number of problems with assessing the value of<br />
NWFP removals. One is that the assessment asked for the value of primary production<br />
(i.e. excluding the income from downstream processing outside the forest), but in many<br />
cases countries reported figures for the values of semi-processed products (which are<br />
often significantly higher to cover transport and labour costs). For example, some<br />
countries provided value data on their production of shea nut butter, which is obtained<br />
by processing the seeds of the Butyrospermum parkii tree, rather than assessing the<br />
value of the seeds. Another example is the case of wild honey, which is collected in<br />
forests and refined and graded (at various levels) before being brought to the market.<br />
Many countries provided value data based on this final market value.<br />
Another problem is many countries only reported the value of their five to ten<br />
most important NWFPs and did not provide estimates of the total value of all NWFPs<br />
TABle 7.7<br />
number of countries reporting value of wood removals by region, 2005<br />
region woodfuel industrial roundwood Total<br />
number of<br />
countries<br />
reporting<br />
% of forest<br />
area<br />
number of<br />
countries<br />
reporting<br />
% of forest<br />
area<br />
number of<br />
countries<br />
reporting<br />
% of forest<br />
area<br />
Africa 23 32 25 46 33 50<br />
Asia 13 24 22 74 24 73<br />
europe 26 96 29 96 29 96<br />
North and Central America 3 53 8 98 8 98<br />
oceania 2 1 6 98 6 98<br />
South America 5 67 12 93 12 93<br />
world 72 57 102 84 112 85<br />
28<br />
Some countries only provided information for the value of woodfuel or industrial roundwood<br />
removals (e.g. Canada, China and Malaysia only provided the latter) and did not present a total on<br />
the FRA questionnaire. In such cases, these figures were used for the totals in the analysis and were<br />
included in the tables presented here.