
Create successful ePaper yourself
Turn your PDF publications into a flip-book with our unique Google optimized e-Paper software.
22<br />
Global Forest Resources Assessment <strong>2010</strong><br />
(or 2.8 percent) for the estimates for 2005. This is mainly because Brazil reported an<br />
additional 53 million hectares of forest as a result of the use of higher resolution remote<br />
sensing imagery and both the Democratic Republic of the Congo and Mozambique<br />
reported more than 20 million hectares of additional forest – some of which was no<br />
doubt due to a reclassification of land earlier reported as other wooded land (see below).<br />
Indonesia reported an additional 9 million hectares for 2005 because the earlier estimate<br />
was forecasted based on data from 2000 and the annual deforestation rate for the 1990s,<br />
while the new estimate utilized updated figures from 2003 and 2006, which show that<br />
the deforestation rate had declined considerably, especially in the period 2000–2005.<br />
Australia, on the other hand, reported 9 million hectares less for 2005 than reported in<br />
the last global assessment. Again, this is due to new information on the actual forest area<br />
(from 2008) and revised annual change rates.<br />
As in FRA 2005, data on deforestation rates were not directly compiled for FRA <strong>2010</strong><br />
because few countries have this information. In FRA 2005 the global deforestation rate<br />
was estimated from net changes in forest area. Additional information on afforestation<br />
and natural expansion of forest for the past 20 years collected for FRA <strong>2010</strong> has now<br />
also made it possible to take into account deforestation and loss from natural causes<br />
within those countries that have had an overall net gain in forest area – including four<br />
of the five countries with the largest forest area in the world. As a result, the revised<br />
estimate of the global rate of deforestation and loss from natural causes for 1990–2000<br />
(close to 16 million hectares per year) is higher, but more accurate, than was estimated in<br />
FRA 2005 (13 million hectares). While the deforestation rate for the tropical countries<br />
for the 1990s did not change significantly as a result of this additional information, the<br />
inclusion of countries in the temperate and boreal zone made a significant difference.<br />
For FRA <strong>2010</strong>, the global area of other wooded land in 2005 is 216 million hectares<br />
lower than that reported for the same year for FRA 2005, despite the fact that figures<br />
are now available for Afghanistan, Brazil, Indonesia and the United States of America,<br />
adding some 113 million hectares (for 2005). The reason is a substantial downward<br />
revision of the estimates of other wooded land in Australia (down 286 million hectares<br />
when comparing the new <strong>2010</strong> figure with the old 2005 figure), Democratic Republic<br />
of the Congo (down 72 million hectares), Saudi Arabia (down 33 million hectares),<br />
Mozambique (down 26 million hectares), Kenya and Mali (both down 6 million<br />
hectares). This is only partially outweighed by the area in the additional countries<br />
and upward revisions in China (up 17 million hectares), Myanmar and the United<br />
Republic of Tanzania (both up 9 million hectares), the Philippines and Colombia (both<br />
up 5 million hectares).<br />
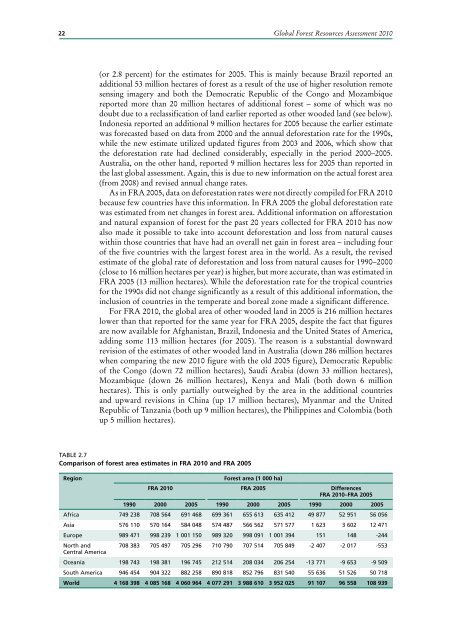
Table 2.7<br />
comparison of forest area estimates in frA <strong>2010</strong> and frA 2005<br />
region<br />
forest area (1 000 ha)<br />
frA <strong>2010</strong> frA 2005 differences<br />
frA <strong>2010</strong>–frA 2005<br />
1990 2000 2005 1990 2000 2005 1990 2000 2005<br />
africa 749 238 708 564 691 468 699 361 655 613 635 412 49 877 52 951 56 056<br />
asia 576 110 570 164 584 048 574 487 566 562 571 577 1 623 3 602 12 471<br />
europe 989 471 998 239 1 001 150 989 320 998 091 1 001 394 151 148 -244<br />
North and<br />
Central america<br />
708 383 705 497 705 296 710 790 707 514 705 849 -2 407 -2 017 -553<br />
Oceania 198 743 198 381 196 745 212 514 208 034 206 254 -13 771 -9 653 -9 509<br />
South america 946 454 904 322 882 258 890 818 852 796 831 540 55 636 51 526 50 718<br />
world 4 168 398 4 085 168 4 060 964 4 077 291 3 988 610 3 952 025 91 107 96 558 108 939