
You also want an ePaper? Increase the reach of your titles
YUMPU automatically turns print PDFs into web optimized ePapers that Google loves.
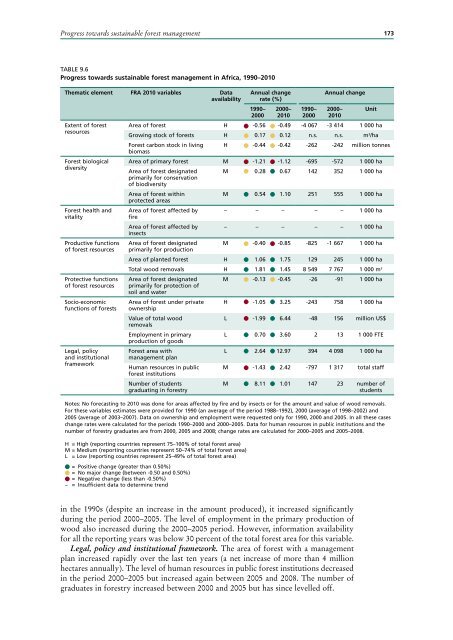
Progress towards sustainable forest management 173<br />
TABLe 9.6<br />
Progress towards sustainable forest management in Africa, 1990–<strong>2010</strong><br />
thematic element FrA <strong>2010</strong> variables data<br />
availability<br />
extent of forest<br />
resources<br />
Forest biological<br />
diversity<br />
Forest health and<br />
vitality<br />
Productive functions<br />
of forest resources<br />
Protective functions<br />
of forest resources<br />
Socio-economic<br />
functions of forests<br />
Legal, policy<br />
and institutional<br />
framework<br />
Annual change<br />
rate (%)<br />
1990–<br />
2000<br />
2000–<br />
<strong>2010</strong><br />
1990–<br />
2000<br />
Annual change<br />
2000–<br />
<strong>2010</strong><br />
Area of forest H -0.56 -0.49 -4 067 -3 414 1 000 ha<br />
growing stock of forests H 0.17 0.12 n.s. n.s. m 3 /ha<br />
Forest carbon stock in living<br />
biomass<br />
H -0.44 -0.42 -262 -242 million tonnes<br />
Area of primary forest M -1.21 -1.12 -695 -572 1 000 ha<br />
Area of forest designated M 0.28 0.67 142 352 1 000 ha<br />
primarily for conservation<br />
of biodiversity<br />
Area of forest within<br />
M 0.54 1.10 251 555 1 000 ha<br />
protected areas<br />
Area of forest affected by – – – – – 1 000 ha<br />
fire<br />
Area of forest affected by – – – – – 1 000 ha<br />
insects<br />
Area of forest designated M -0.40 -0.85 -825 -1 667 1 000 ha<br />
primarily for production<br />
Area of planted forest H 1.06 1.75 129 245 1 000 ha<br />
Total wood removals H 1.81 1.45 8 549 7 767 1 000 m 3<br />
Area of forest designated M -0.13 -0.45 -26 -91 1 000 ha<br />
primarily for protection of<br />
soil and water<br />
Area of forest under private H -1.05 3.25 -243 758 1 000 ha<br />
ownership<br />
Value of total wood<br />
L -1.99 6.44 -48 156 million uS$<br />
removals<br />
employment in primary<br />
L 0.70 3.60 2 13 1 000 FTe<br />
production of goods<br />
Forest area with<br />
L 2.64 12.97 394 4 098 1 000 ha<br />
management plan<br />
Human resources in public M -1.43 2.42 -797 1 317 total staff<br />
forest institutions<br />
Number of students<br />
graduating in forestry<br />
unit<br />
M 8.11 1.01 147 23 number of<br />
students<br />
Notes: No forecasting to <strong>2010</strong> was done for areas affected by fire and by insects or for the amount and value of wood removals.<br />
For these variables estimates were provided for 1990 (an average of the period 1988–1992), 2000 (average of 1998–2002) and<br />
2005 (average of 2003–2007). Data on ownership and employment were requested only for 1990, 2000 and 2005. in all these cases<br />
change rates were calculated for the periods 1990–2000 and 2000–2005. Data for human resources in public institutions and the<br />
number of forestry graduates are from 2000, 2005 and 2008; change rates are calculated for 2000–2005 and 2005–2008.<br />
H = High (reporting countries represent 75–100% of total forest area)<br />
M = Medium (reporting countries represent 50–74% of total forest area)<br />
L = Low (reporting countries represent 25–49% of total forest area)<br />
= Positive change (greater than 0.50%)<br />
= No major change (between -0.50 and 0.50%)<br />
= Negative change (less than -0.50%)<br />
– = insufficient data to determine trend<br />
in the 1990s (despite an increase in the amount produced), it increased significantly<br />
during the period 2000–2005. The level of employment in the primary production of<br />
wood also increased during the 2000–2005 period. However, information availability<br />
for all the reporting years was below 30 percent of the total forest area for this variable.<br />
Legal, policy and institutional framework. The area of forest with a management<br />
plan increased rapidly over the last ten years (a net increase of more than 4 million<br />
hectares annually). The level of human resources in public forest institutions decreased<br />
in the period 2000–2005 but increased again between 2005 and 2008. The number of<br />
graduates in forestry increased between 2000 and 2005 but has since levelled off.