
You also want an ePaper? Increase the reach of your titles
YUMPU automatically turns print PDFs into web optimized ePapers that Google loves.
Forest biological diversity 55<br />
over the ten-year period, is largely due to the reclassification of primary forest to other<br />
categories of forest because of selective logging and other human interventions during<br />
this period. However, information is still insufficient to determine precisely what<br />
proportion of the decrease in primary forest is due to deforestation and what is due to a<br />
reclassification to one of the two other categories: ‘other naturally regenerated forests’<br />
and ‘planted forests’.<br />
South America accounted for the largest proportion of the net loss, followed by<br />
Africa and Asia. The rate of loss is stable or decreasing in all regions except Oceania,<br />
where it is increasing (primarily as a result of a higher reported loss from Papua New<br />
Guinea for the period 2005–<strong>2010</strong>); and in Europe, and North and Central America<br />
which registered a net gain (Table 3.3). 15<br />
At the subregional level, the loss of primary forests in Eastern and Southern<br />
Africa has increased slightly, primarily due to an increased rate of loss reported by<br />
Madagascar. In Northern Africa a significant reduction in the rate of loss is reported by<br />
Sudan, while in Western and Central Africa, a slight decrease in the rate of loss reported<br />
by Gabon and Nigeria influence the subregional totals.<br />
Overall, the rate of loss of primary forest decreased in East Asia. The Republic of<br />
Korea reported the largest loss in this subregion. In contrast, Japan is increasing its<br />
net gain (see below) and Mongolia reported a decrease in its net loss. In South and<br />
Southeast Asia, Indonesia reported the largest loss of primary forest, but did not<br />
provide an estimate for 1990; the annual net loss for the 1990s was therefore assumed<br />
to be the same as in 2000–2005 for the purpose of Table 3.3 and is likely to be an<br />
underestimate. Over the period 2000–<strong>2010</strong>, Indonesia reported a significant reduction<br />
in the average annual area lost in the five years 2005–<strong>2010</strong>, compared with 2000–2005.<br />
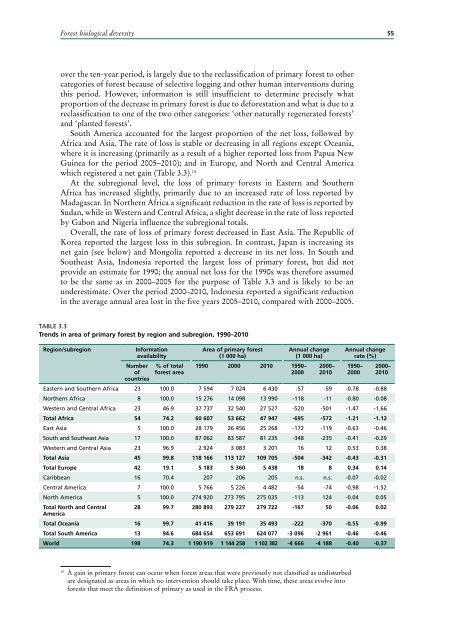
TABle 3.3<br />
Trends in area of primary forest by region and subregion, 1990–<strong>2010</strong><br />
region/subregion<br />
information<br />
availability<br />
number<br />
of<br />
countries<br />
% of total<br />
forest area<br />
Area of primary forest<br />
(1 000 ha)<br />
1990 2000 <strong>2010</strong> 1990–<br />
2000<br />
Annual change<br />
(1 000 ha)<br />
2000–<br />
<strong>2010</strong><br />
Annual change<br />
rate (%)<br />
eastern and Southern Africa 23 100.0 7 594 7 024 6 430 -57 -59 -0.78 -0.88<br />
Northern Africa 8 100.0 15 276 14 098 13 990 -118 -11 -0.80 -0.08<br />
Western and Central Africa 23 46.9 37 737 32 540 27 527 -520 -501 -1.47 -1.66<br />
Total Africa 54 74.2 60 607 53 662 47 947 -695 -572 -1.21 -1.12<br />
east Asia 5 100.0 28 179 26 456 25 268 -172 -119 -0.63 -0.46<br />
South and Southeast Asia 17 100.0 87 062 83 587 81 235 -348 -235 -0.41 -0.29<br />
Western and Central Asia 23 96.9 2 924 3 083 3 201 16 12 0.53 0.38<br />
Total Asia 45 99.8 118 166 113 127 109 705 -504 -342 -0.43 -0.31<br />
Total europe 42 19.1 5 183 5 360 5 438 18 8 0.34 0.14<br />
Caribbean 16 70.4 207 206 205 n.s. n.s. -0.07 -0.02<br />
Central America 7 100.0 5 766 5 226 4 482 -54 -74 -0.98 -1.52<br />
North America 5 100.0 274 920 273 795 275 035 -113 124 -0.04 0.05<br />
Total north and central 28 99.7 280 893 279 227 279 722 -167 50 -0.06 0.02<br />
America<br />
Total Oceania 16 99.7 41 416 39 191 35 493 -222 -370 -0.55 -0.99<br />
Total south America 13 94.6 684 654 653 691 624 077 -3 096 -2 961 -0.46 -0.46<br />
world 198 74.3 1 190 919 1 144 258 1 102 382 -4 666 -4 188 -0.40 -0.37<br />
1990–<br />
2000<br />
2000–<br />
<strong>2010</strong><br />
15<br />
A gain in primary forest can occur when forest areas that were previously not classified as undisturbed<br />
are designated as areas in which no intervention should take place. With time, these areas evolve into<br />
forests that meet the definition of primary as used in the FRA process.