- Page 2 and 3: Cover photos: Seven themes of susta
- Page 4 and 5: The designations employed and the p
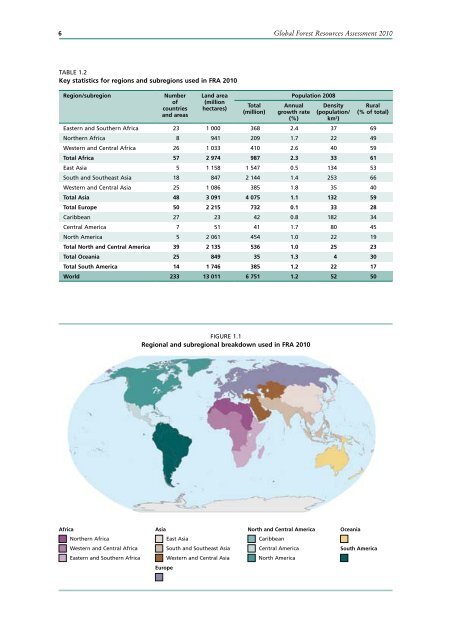
- Page 6 and 7: iv Afforestation and reforestation
- Page 8 and 9: vi 4.2 Average area of forest annua
- Page 10 and 11: viii 3.3 Proportion of forest area
- Page 12 and 13: x Acknowledgements The FRA 2010 mai
- Page 14 and 15: xii Acronyms and abbreviations CBD
- Page 16 and 17: xiv FIGURE 1 The world’s forests
- Page 18 and 19: xvi BOx 3 A global remote sensing s
- Page 20 and 21: xviii Primary forests account for 3
- Page 22 and 23: xx Legally established protected ar
- Page 24 and 25: xxii The value of wood removals is
- Page 26 and 27: xxiv FIGURE 15 Public expenditure o
- Page 28 and 29: xxvi FIGURE 19 Designated functions
- Page 30 and 31: xxviii TABLE 1 Progress towards sus
- Page 32 and 33: xxx TABLE 2 Progress towards sustai
- Page 35 and 36: 1 Chapter 1 Introduction Global for
- Page 37 and 38: Introduction 3 recent agreement rel
- Page 39: Introduction 5 as the guidelines fo
- Page 43 and 44: 9 Chapter 2 Extent of forest resour
- Page 45 and 46: Extent of forest resources 11 More
- Page 47 and 48: Extent of forest resources 13 Table
- Page 49 and 50: Extent of forest resources 15 Table
- Page 51 and 52: Extent of forest resources 17 At th
- Page 53 and 54: Extent of forest resources 19 recen
- Page 55 and 56: Extent of forest resources 21 Table
- Page 57 and 58: Extent of forest resources 23 concl
- Page 59 and 60: Extent of forest resources 25 Easy
- Page 61 and 62: Extent of forest resources 27 speci
- Page 63 and 64: Extent of forest resources 29 Figur
- Page 65 and 66: Extent of forest resources 31 count
- Page 67 and 68: Extent of forest resources 33 Annua
- Page 69 and 70: Extent of forest resources 35 grOwi
- Page 71 and 72: Extent of forest resources 37 About
- Page 73 and 74: Extent of forest resources 39 the F
- Page 75 and 76: Extent of forest resources 41 concl
- Page 77 and 78: Extent of forest resources 43 the g
- Page 79 and 80: Extent of forest resources 45 Quant
- Page 81 and 82: Extent of forest resources 47 For c
- Page 83 and 84: 49 Chapter 3 Forest biological dive
- Page 85 and 86: Forest biological diversity 51 Anal
- Page 87 and 88: Forest biological diversity 53 TABl
- Page 89 and 90: Forest biological diversity 55 over
- Page 91 and 92:
Forest biological diversity 57 indi
- Page 93 and 94:
Forest biological diversity 59 FIGu
- Page 95 and 96:
Forest biological diversity 61 Howe
- Page 97:
Forest biological diversity 63 TABl
- Page 100 and 101:
66 Global Forest Resources Assessme
- Page 102 and 103:
68 Global Forest Resources Assessme
- Page 104 and 105:
70 Global Forest Resources Assessme
- Page 106 and 107:
72 Global Forest Resources Assessme
- Page 108 and 109:
74 Global Forest Resources Assessme
- Page 110 and 111:
76 Global Forest Resources Assessme
- Page 112 and 113:
78 Global Forest Resources Assessme
- Page 114 and 115:
80 Global Forest Resources Assessme
- Page 116 and 117:
82 Global Forest Resources Assessme
- Page 119 and 120:
85 Chapter 5 Productive functions o
- Page 121 and 122:
Productive functions of forest reso
- Page 123 and 124:
Productive functions of forest reso
- Page 125 and 126:
Productive functions of forest reso
- Page 127 and 128:
Productive functions of forest reso
- Page 129 and 130:
Productive functions of forest reso
- Page 131 and 132:
Productive functions of forest reso
- Page 133 and 134:
Productive functions of forest reso
- Page 135 and 136:
Productive functions of forest reso
- Page 137 and 138:
Productive functions of forest reso
- Page 139 and 140:
Productive functions of forest reso
- Page 141:
Productive functions of forest reso
- Page 144 and 145:
110 Global Forest Resources Assessm
- Page 146 and 147:
112 Global Forest Resources Assessm
- Page 148 and 149:
114 Global Forest Resources Assessm
- Page 150 and 151:
116 Global Forest Resources Assessm
- Page 153 and 154:
119 Chapter 7 Socio-economic functi
- Page 155 and 156:
Socio-economic functions of forest
- Page 157 and 158:
Socio-economic functions of forest
- Page 159 and 160:
Socio-economic functions of forest
- Page 161 and 162:
Socio-economic functions of forest
- Page 163 and 164:
Socio-economic functions of forest
- Page 165 and 166:
Socio-economic functions of forest
- Page 167 and 168:
Socio-economic functions of forest
- Page 169 and 170:
Socio-economic functions of forest
- Page 171 and 172:
Socio-economic functions of forest
- Page 173 and 174:
Socio-economic functions of forest
- Page 175 and 176:
Socio-economic functions of forest
- Page 177 and 178:
Socio-economic functions of forest
- Page 179 and 180:
Socio-economic functions of forest
- Page 181 and 182:
Socio-economic functions of forest
- Page 183 and 184:
149 Chapter 8 Legal, policy and ins
- Page 185 and 186:
Legal, policy and institutional fra
- Page 187 and 188:
Legal, policy and institutional fra
- Page 189 and 190:
Legal, policy and institutional fra
- Page 191 and 192:
Legal, policy and institutional fra
- Page 193 and 194:
Legal, policy and institutional fra
- Page 195 and 196:
Legal, policy and institutional fra
- Page 197 and 198:
163 Chapter 9 Progress towards sust
- Page 199 and 200:
Progress towards sustainable forest
- Page 201 and 202:
Progress towards sustainable forest
- Page 203 and 204:
Progress towards sustainable forest
- Page 205 and 206:
Progress towards sustainable forest
- Page 207 and 208:
Progress towards sustainable forest
- Page 209 and 210:
Progress towards sustainable forest
- Page 211 and 212:
Progress towards sustainable forest
- Page 213 and 214:
Progress towards sustainable forest
- Page 215 and 216:
Progress towards sustainable forest
- Page 217 and 218:
Progress towards sustainable forest
- Page 219 and 220:
Progress towards sustainable forest
- Page 221 and 222:
187 Chapter 10 Conclusions FAO has
- Page 223 and 224:
Conclusions 189 FIGurE 10.1 Informa
- Page 225 and 226:
Conclusions 191 BOx 10.2 Special st
- Page 227:
Conclusions 193 positive news Howev
- Page 230 and 231:
196 Global Forest Resources Assessm
- Page 232 and 233:
198 Global Forest Resources Assessm
- Page 234 and 235:
200 Global Forest Resources Assessm
- Page 236 and 237:
202 Global Forest Resources Assessm
- Page 238 and 239:
204 Global Forest Resources Assessm
- Page 240 and 241:
206 Global Forest Resources Assessm
- Page 243 and 244:
209 Annex 2 Terms and definitions u
- Page 245 and 246:
Annex 2: Terms and definitions used
- Page 247 and 248:
Annex 2: Terms and definitions used
- Page 249 and 250:
Annex 2: Terms and definitions used
- Page 251 and 252:
217 Annex 3 Global tables NOTES Cou
- Page 253 and 254:
Annex 3: Global tables 219 Country/
- Page 255 and 256:
Annex 3: Global tables 221 Country/
- Page 257 and 258:
Annex 3: Global tables 223 Country/
- Page 259 and 260:
Annex 3: Global tables 225 TAble 2
- Page 261 and 262:
Annex 3: Global tables 227 TAble 2
- Page 263 and 264:
Annex 3: Global tables 229 Country/
- Page 265 and 266:
Annex 3: Global tables 231 Country/
- Page 267 and 268:
Annex 3: Global tables 233 Country/
- Page 269 and 270:
Annex 3: Global tables 235 Country/
- Page 271 and 272:
Annex 3: Global tables 237 Country/
- Page 273 and 274:
Annex 3: Global tables 239 Country/
- Page 275 and 276:
Annex 3: Global tables 241 Country/
- Page 277 and 278:
Annex 3: Global tables 243 Country/
- Page 279 and 280:
Annex 3: Global tables 245 TAble 6
- Page 281 and 282:
Annex 3: Global tables 247 TAble 6
- Page 283 and 284:
Annex 3: Global tables 249 TAble 6
- Page 285 and 286:
Annex 3: Global tables 251 Country/
- Page 287 and 288:
Annex 3: Global tables 253 Country/
- Page 289 and 290:
Annex 3: Global tables 255 Country/
- Page 291 and 292:
Annex 3: Global tables 257 Country/
- Page 293 and 294:
Annex 3: Global tables 259 Country/
- Page 295 and 296:
Annex 3: Global tables 261 Country/
- Page 297 and 298:
Annex 3: Global tables 263 Country/
- Page 299 and 300:
Annex 3: Global tables 265 Country/
- Page 301 and 302:
Annex 3: Global tables 267 Country/
- Page 303 and 304:
Annex 3: Global tables 269 Country/
- Page 305 and 306:
Annex 3: Global tables 271 Country/
- Page 307 and 308:
Annex 3: Global tables 273 Country/
- Page 309 and 310:
Annex 3: Global tables 275 Country/
- Page 311 and 312:
Annex 3: Global tables 277 TAble 12
- Page 313 and 314:
Annex 3: Global tables 279 TAble 12
- Page 315 and 316:
Annex 3: Global tables 281 TAble 12
- Page 317 and 318:
Annex 3: Global tables 283 TAble 13
- Page 319 and 320:
Annex 3: Global tables 285 TAble 13
- Page 321 and 322:
Annex 3: Global tables 287 TAble 13
- Page 323 and 324:
Annex 3: Global tables 289 Country/
- Page 325 and 326:
Annex 3: Global tables 291 Country/
- Page 327 and 328:
Annex 3: Global tables 293 a Countr
- Page 329 and 330:
Annex 3: Global tables 295 TAble 15
- Page 331 and 332:
Annex 3: Global tables 297 TAble 15
- Page 333 and 334:
Annex 3: Global tables 299 TAble 16
- Page 335 and 336:
Annex 3: Global tables 301 Country/
- Page 337 and 338:
Annex 3: Global tables 303 Country/
- Page 339 and 340:
Annex 3: Global tables 305 TAble 17
- Page 341 and 342:
Annex 3: Global tables 307 TAble 17
- Page 343 and 344:
Annex 3: Global tables 309 Country/
- Page 345 and 346:
Annex 3: Global tables 311 Country/
- Page 347 and 348:
Annex 3: Global tables 313 Country/
- Page 349 and 350:
Annex 3: Global tables 315 Country/
- Page 351 and 352:
Annex 3: Global tables 317 Country/
- Page 353 and 354:
Annex 3: Global tables 319 Country/
- Page 355 and 356:
Annex 3: Global tables 321 TAble 20
- Page 357 and 358:
Annex 3: Global tables 323 TAble 20
- Page 359 and 360:
Annex 3: Global tables 325 TAble 20
- Page 361 and 362:
327 Annex 4 FRA 2010 Working papers
- Page 363:
Annex 4: FRA 2010 working papers 32
- Page 366 and 367:
332 Global Forest Resources Assessm
- Page 368 and 369:
334 Global Forest Resources Assessm
- Page 370 and 371:
336 Global Forest Resources Assessm
- Page 372 and 373:
338 Global Forest Resources Assessm
- Page 374 and 375:
340 Global Forest Resources Assessm