HUNTERDON CENTRAL REGIONAL HIGH SCHOOL DISTRICT
HUNTERDON CENTRAL REGIONAL HIGH SCHOOL DISTRICT
HUNTERDON CENTRAL REGIONAL HIGH SCHOOL DISTRICT

Create successful ePaper yourself
Turn your PDF publications into a flip-book with our unique Google optimized e-Paper software.
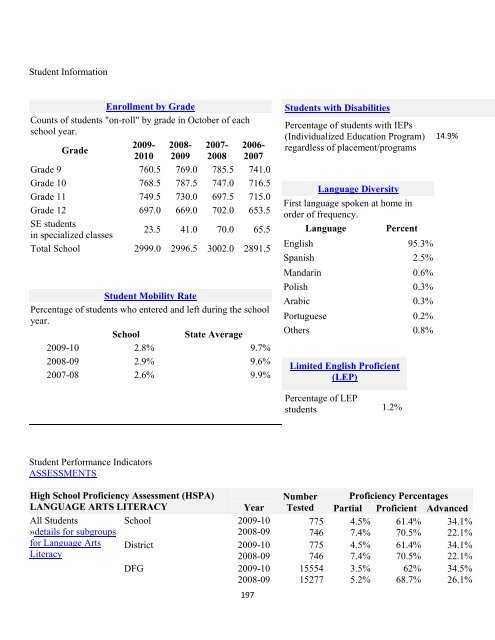
Student Information<br />
Enrollment by Grade<br />
Counts of students "on-roll" by grade in October of each<br />
school year.<br />
Grade<br />
2009- 2008- 2007- 2006-<br />
2010 2009 2008 2007<br />
Grade 9 760.5 769.0 785.5 741.0<br />
Grade 10 768.5 787.5 747.0 716.5<br />
Grade 11 749.5 730.0 697.5 715.0<br />
Grade 12 697.0 669.0 702.0 653.5<br />
SE students<br />
in specialized classes<br />
23.5 41.0 70.0 65.5<br />
Total School 2999.0 2996.5 3002.0 2891.5<br />
Student Mobility Rate<br />
Percentage of students who entered and left during the school<br />
year.<br />
School State Average<br />
2009-10 2.8% 9.7%<br />
2008-09 2.9% 9.6%<br />
2007-08 2.6% 9.9%<br />
Students with Disabilities<br />
Percentage of students with IEPs<br />
(Individualized Education Program)<br />
regardless of placement/programs<br />
Language Diversity<br />
First language spoken at home in<br />
order of frequency.<br />
Language Percent<br />
English 95.3%<br />
Spanish 2.5%<br />
Mandarin 0.6%<br />
Polish 0.3%<br />
Arabic 0.3%<br />
Portuguese 0.2%<br />
Others 0.8%<br />
Limited English Proficient<br />
(LEP)<br />
14.9%<br />
Percentage of LEP<br />
students 1.2%<br />
Student Performance Indicators<br />
ASSESSMENTS<br />
High School Proficiency Assessment (HSPA)<br />
LANGUAGE ARTS LITERACY<br />
Year<br />
All Students School 2009-10<br />
»details for subgroups<br />
2008-09<br />
for Language Arts District 2009-10<br />
Literacy<br />
2008-09<br />
DFG 2009-10<br />
2008-09<br />
197<br />
Number Proficiency Percentages<br />
Tested Partial Proficient Advanced<br />
775 4.5% 61.4% 34.1%<br />
746 7.4% 70.5% 22.1%<br />
775 4.5% 61.4% 34.1%<br />
746 7.4% 70.5% 22.1%<br />
15554 3.5% 62% 34.5%<br />
15277 5.2% 68.7% 26.1%