Volume 11 Issue 1 (February) - Australasian Society for Ultrasound ...
Volume 11 Issue 1 (February) - Australasian Society for Ultrasound ...
Volume 11 Issue 1 (February) - Australasian Society for Ultrasound ...

You also want an ePaper? Increase the reach of your titles
YUMPU automatically turns print PDFs into web optimized ePapers that Google loves.
Australian charts <strong>for</strong> assessing fetal growth – a review<br />
Fig.2: Hadlock's chart.<br />
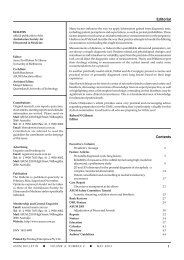
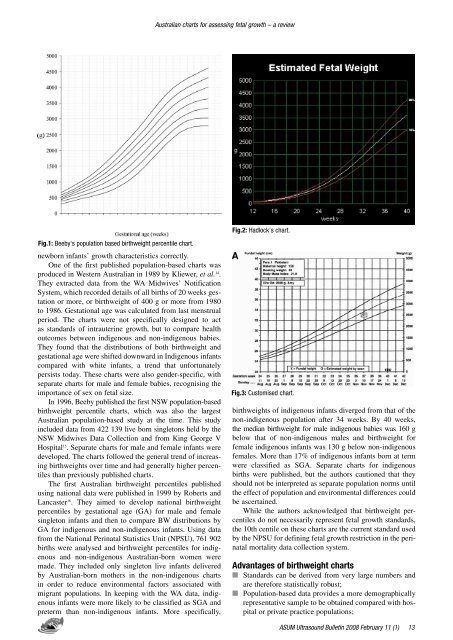
Fig.1: Beeby's population based birthweight percentile chart.<br />
newborn infants’ growth characteristics correctly.<br />
One of the first published population-based charts was<br />
produced in Western Australian in 1989 by Kliewer, et al. 14 .<br />
They extracted data from the WA Midwives’ Notification<br />
System, which recorded details of all births of 20 weeks gestation<br />
or more, or birthweight of 400 g or more from 1980<br />
to 1986. Gestational age was calculated from last menstrual<br />
period. The charts were not specifically designed to act<br />
as standards of intrauterine growth, but to compare health<br />
outcomes between indigenous and non-indigenous babies.<br />
They found that the distributions of both birthweight and<br />
gestational age were shifted downward in Indigenous infants<br />
compared with white infants, a trend that un<strong>for</strong>tunately<br />
persists today. These charts were also gender-specific, with<br />
separate charts <strong>for</strong> male and female babies, recognising the<br />
importance of sex on fetal size.<br />
In 1996, Beeby published the first NSW population-based<br />
birthweight percentile charts, which was also the largest<br />
Australian population-based study at the time. This study<br />
included data from 422 139 live born singletons held by the<br />
NSW Midwives Data Collection and from King George V<br />
Hospital 15 . Separate charts <strong>for</strong> male and female infants were<br />
developed. The charts followed the general trend of increasing<br />
birthweights over time and had generally higher percentiles<br />
than previously published charts.<br />
The first Australian birthweight percentiles published<br />
using national data were published in 1999 by Roberts and<br />
Lancaster 16 . They aimed to develop national birthweight<br />
percentiles by gestational age (GA) <strong>for</strong> male and female<br />
singleton infants and then to compare BW distributions by<br />
GA <strong>for</strong> indigenous and non-indigenous infants. Using data<br />
from the National Perinatal Statistics Unit (NPSU), 761 902<br />
births were analysed and birthweight percentiles <strong>for</strong> indigenous<br />
and non-indigenous Australian-born women were<br />
made. They included only singleton live infants delivered<br />
by Australian-born mothers in the non-indigenous charts<br />
in order to reduce environmental factors associated with<br />
migrant populations. In keeping with the WA data, indigenous<br />
infants were more likely to be classified as SGA and<br />
preterm than non-indigenous infants. More specifically,<br />
Fig.3: Customised chart.<br />
birthweights of indigenous infants diverged from that of the<br />
non-indigenous population after 34 weeks. By 40 weeks,<br />
the median birthweight <strong>for</strong> male indigenous babies was 160 g<br />
below that of non-indigenous males and birthweight <strong>for</strong><br />
female indigenous infants was 130 g below non-indigenous<br />
females. More than 17% of indigenous infants born at term<br />
were classified as SGA. Separate charts <strong>for</strong> indigenous<br />
births were published, but the authors cautioned that they<br />
should not be interpreted as separate population norms until<br />
the effect of population and environmental differences could<br />
be ascertained.<br />
While the authors acknowledged that birthweight percentiles<br />
do not necessarily represent fetal growth standards,<br />
the 10th centile on these charts are the current standard used<br />
by the NPSU <strong>for</strong> defining fetal growth restriction in the perinatal<br />
mortality data collection system.<br />
Advantages of birthweight charts<br />
n Standards can be derived from very large numbers and<br />
are there<strong>for</strong>e statistically robust;<br />
n Population-based data provides a more demographically<br />
representative sample to be obtained compared with hospital<br />
or private practice populations;<br />
ASUM <strong>Ultrasound</strong> Bulletin 2008 <strong>February</strong> <strong>11</strong> (1)