Volume 11 Issue 1 (February) - Australasian Society for Ultrasound ...
Volume 11 Issue 1 (February) - Australasian Society for Ultrasound ...
Volume 11 Issue 1 (February) - Australasian Society for Ultrasound ...

Create successful ePaper yourself
Turn your PDF publications into a flip-book with our unique Google optimized e-Paper software.
Lisa Hui<br />
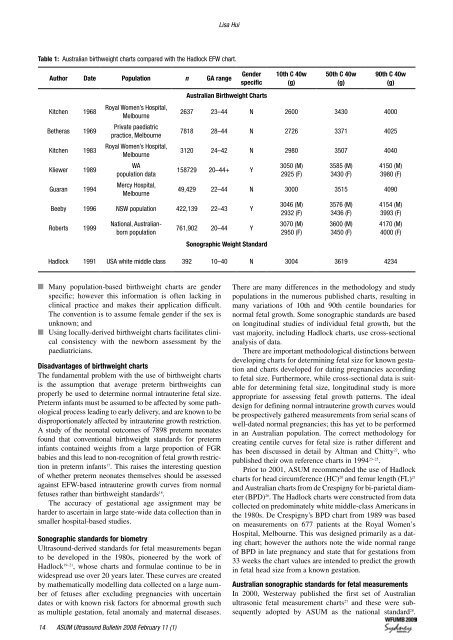
Table 1: Australian birthweight charts compared with the Hadlock EFW chart.<br />
Author Date Population n GA range<br />
Kitchen 1968<br />
Betheras 1969<br />
Kitchen 1983<br />
Kliewer 1989<br />
Guaran 1994<br />
Royal Women’s Hospital,<br />
Melbourne<br />
Private paediatric<br />
practice, Melbourne<br />
Royal Women’s Hospital,<br />
Melbourne<br />
WA<br />
population data<br />
Mercy Hospital,<br />
Melbourne<br />
Gender<br />
specific<br />
Australian Birthweight Charts<br />
10th C 40w<br />
(g)<br />
50th C 40w<br />
(g)<br />
90th C 40w<br />
(g)<br />
2637 23–44 N 2600 3430 4000<br />
7818 28–44 N 2726 3371 4025<br />
3120 24–42 N 2980 3507 4040<br />
158729 20–44+ Y<br />
Beeby 1996 NSW population 422,139 22–43 Y<br />
Roberts 1999<br />
National, Australianborn<br />
population<br />
3050 (M)<br />
2925 (F)<br />
3585 (M)<br />
3430 (F)<br />
4150 (M)<br />
3980 (F)<br />
49,429 22–44 N 3000 3515 4090<br />
761,902 20–44 Y<br />
Sonographic Weight Standard<br />
3046 (M)<br />
2932 (F)<br />
3070 (M)<br />
2950 (F)<br />
3576 (M)<br />
3436 (F)<br />
3600 (M)<br />
3450 (F)<br />
4154 (M)<br />
3993 (F)<br />
4170 (M)<br />
4000 (F)<br />
Hadlock 1991 USA white middle class 392 10–40 N 3004 3619 4234<br />
n Many population-based birthweight charts are gender<br />
specific; however this in<strong>for</strong>mation is often lacking in<br />
clinical practice and makes their application difficult.<br />
The convention is to assume female gender if the sex is<br />
unknown; and<br />
n Using locally-derived birthweight charts facilitates clinical<br />
consistency with the newborn assessment by the<br />
paediatricians.<br />
Disadvantages of birthweight charts<br />
The fundamental problem with the use of birthweight charts<br />
is the assumption that average preterm birthweights can<br />
properly be used to determine normal intrauterine fetal size.<br />
Preterm infants must be assumed to be affected by some pathological<br />
process leading to early delivery, and are known to be<br />
disproportionately affected by intrauterine growth restriction.<br />
A study of the neonatal outcomes of 7898 preterm neonates<br />
found that conventional birthweight standards <strong>for</strong> preterm<br />
infants contained weights from a large proportion of FGR<br />
babies and this lead to non-recognition of fetal growth restriction<br />
in preterm infants 17 . This raises the interesting question<br />
of whether preterm neonates themselves should be assessed<br />
against EFW-based intrauterine growth curves from normal<br />
fetuses rather than birthweight standards 18 .<br />
The accuracy of gestational age assignment may be<br />
harder to ascertain in large state-wide data collection than in<br />
smaller hospital-based studies.<br />
Sonographic standards <strong>for</strong> biometry<br />
<strong>Ultrasound</strong>-derived standards <strong>for</strong> fetal measurements began<br />
to be developed in the 1980s, pioneered by the work of<br />
Hadlock 19–21 , whose charts and <strong>for</strong>mulae continue to be in<br />
widespread use over 20 years later. These curves are created<br />
by mathematically modelling data collected on a large number<br />
of fetuses after excluding pregnancies with uncertain<br />
dates or with known risk factors <strong>for</strong> abnormal growth such<br />
as multiple gestation, fetal anomaly and maternal diseases.<br />
There are many differences in the methodology and study<br />
populations in the numerous published charts, resulting in<br />
many variations of 10th and 90th centile boundaries <strong>for</strong><br />
normal fetal growth. Some sonographic standards are based<br />
on longitudinal studies of individual fetal growth, but the<br />
vast majority, including Hadlock charts, use cross-sectional<br />
analysis of data.<br />
There are important methodological distinctions between<br />
developing charts <strong>for</strong> determining fetal size <strong>for</strong> known gestation<br />
and charts developed <strong>for</strong> dating pregnancies according<br />
to fetal size. Furthermore, while cross-sectional data is suitable<br />
<strong>for</strong> determining fetal size, longitudinal study is more<br />
appropriate <strong>for</strong> assessing fetal growth patterns. The ideal<br />
design <strong>for</strong> defining normal intrauterine growth curves would<br />
be prospectively gathered measurements from serial scans of<br />
well-dated normal pregnancies; this has yet to be per<strong>for</strong>med<br />
in an Australian population. The correct methodology <strong>for</strong><br />
creating centile curves <strong>for</strong> fetal size is rather different and<br />
has been discussed in detail by Altman and Chitty 22 , who<br />
published their own reference charts in 1994 23–25 .<br />
Prior to 2001, ASUM recommended the use of Hadlock<br />
charts <strong>for</strong> head circumference (HC) 20 and femur length (FL) 21<br />
and Australian charts from de Crespigny <strong>for</strong> bi-parietal diameter<br />
(BPD) 26 . The Hadlock charts were constructed from data<br />
collected on predominately white middle-class Americans in<br />
the 1980s. De Crespigny's BPD chart from 1989 was based<br />
on measurements on 677 patients at the Royal Women’s<br />
Hospital, Melbourne. This was designed primarily as a dating<br />
chart; however the authors note the wide normal range<br />
of BPD in late pregnancy and state that <strong>for</strong> gestations from<br />
33 weeks the chart values are intended to predict the growth<br />
in fetal head size from a known gestation.<br />
Australian sonographic standards <strong>for</strong> fetal measurements<br />
In 2000, Westerway published the first set of Australian<br />
ultrasonic fetal measurement charts 27 and these were subsequently<br />
adopted by ASUM as the national standard 28 .<br />
4 ASUM <strong>Ultrasound</strong> Bulletin 2008 <strong>February</strong> <strong>11</strong> (1)