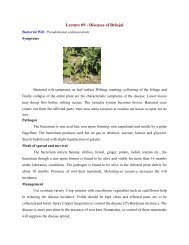
season and crop report tamilnadu 2009-10
season and crop report tamilnadu 2009-10
season and crop report tamilnadu 2009-10

You also want an ePaper? Increase the reach of your titles
YUMPU automatically turns print PDFs into web optimized ePapers that Google loves.
Misc.Tree Crops <strong>and</strong> Groves not<br />
included In the Net Area Sown<br />
All cultivable l<strong>and</strong>s, which is not<br />
included under net area sown, but is put to<br />
some agricultural use such as l<strong>and</strong>s under<br />
casuarina, eucalyptus, teak, bamboo bushes,<br />
babul, thatching grass <strong>and</strong> other groves for<br />
fuel etc. which are not included under orchards<br />
<strong>and</strong> which bear yield only once in its whole life<br />
span are classified under this category. The<br />
extent under this category during 09-<strong>10</strong> was<br />
252828 ha i.e. 1.9% of the geographical area<br />
of the state. Thoothukudi district with 38325 ha<br />
ranked first contributing 15.2% to the total area<br />
of the state under this category followed by<br />
Ramanathapuram district with 34518 ha<br />
(13.7%) <strong>and</strong> Pudukottai district with 28<strong>10</strong>3 ha<br />
(11.1%).<br />
Current Fallow L<strong>and</strong>s<br />
L<strong>and</strong>s that are kept fallow out of the<br />
net area sown during the previous year are<br />
classified as current fallow for the <strong>report</strong>ing<br />
year. The area under current fallow during<br />
09-<strong>10</strong> was 1116981 ha (8.6%). The extent<br />
under this category is the highest in<br />
Thiruvannamalai district ( 121263 ha) followed<br />
by Thiruppur 98292 ha, Villupuram 87735 ha,<br />
Vellore 69546, Erode 64311 ha, Salem 57824<br />
ha <strong>and</strong> Coimbatore 55792 ha. These districts<br />
together accounted for 49.7% of the total area<br />
of the state under this category.<br />
Other Fallow L<strong>and</strong><br />
L<strong>and</strong> which were taken up for<br />
cultivation but have been temporarily put off<br />
cultivation for a period of not less than one<br />
poverty of the cultivators, inadequeate supply<br />
of water, silting of canals <strong>and</strong> rivers, etc. are<br />
treated as other fallow l<strong>and</strong>. An extent of<br />
1542137 ha, which is 11.4% of the total<br />
geographical area, was recorded under this<br />
category during 09-<strong>10</strong> as against 1497549 ha<br />
during the previous year. The l<strong>and</strong> under this<br />
category was highest in Virudhunagar district<br />
with 167393 ha followed by Tirunelveli district<br />
with 166649 ha, Sivagangai district with<br />
124569 ha, Dindigul with 111579 ha, <strong>and</strong><br />
Tiruppur district with <strong>10</strong>2623 ha during 09-<strong>10</strong>.<br />
Net Area Sown<br />
Net area sown represents the area<br />
sown under first <strong>crop</strong> during the fasli year. Out<br />
of 13033072 ha of the total geographical area,<br />
4892142 ha of l<strong>and</strong> constituting 37.5% was<br />
cultivated once with various <strong>crop</strong>s during the<br />
year 09-<strong>10</strong>. When compared to the previous<br />
year, the area under this category has<br />
decreased by 150754 ha (3.0%). Of the total<br />
net area sown in the State, the share of<br />
Villupuram district was the highest with<br />
333997 ha (6.8%) followed by Dindigul district<br />
with 2<strong>2009</strong>2 ha (4.6%), Cuddalore district with<br />
212664 ha (4.5%), salem with 208126 (4.3%),<br />
Thiruvannamalai with 199536 (4.1%), <strong>and</strong><br />
Erode district with 199389 ha (4.0%). When<br />
comparing the net area sown with that of the<br />
geographical area of the district, Thiruvarur<br />
<strong>and</strong> Tirunelveli districts are ranked first <strong>and</strong><br />
least, contributing 74.4% <strong>and</strong> 23.0% of its<br />
geographical area respectively towards this<br />
category.<br />
The net area sown in each district, its<br />
percentage contribution to its geographical<br />
area <strong>and</strong> the percentage share of each<br />
year but not more than five years due to<br />
<strong>10</strong>