- Page 1 and 2: R.No. 6 / 2011 SEASON AND CROP REPO
- Page 3 and 4: Crop wise area and land use pattern
- Page 5 and 6: IV Area Under Crops Contents Page A
- Page 7 and 8: Considering the area irrigated unde
- Page 9 and 10: Winter Season (Jan ’10 & Feb’10
- Page 11 and 12: 2. Agro Climatic Zones in Tamil Nad
- Page 13 and 14: CLASSIFICATION OF LAND AREA 09-10 F
- Page 15 and 16: Misc.Tree Crops and Groves not incl
- Page 17 and 18: Gross Area Sown The Gross area sown
- Page 19 and 20: SOURCEWISE NET AREA IRRIGATED 09-10
- Page 21 and 22: WATER LEVELS OF IMPORTANT RESERVOIR
- Page 23 and 24: DISTRICTWISE DISTRIBUTION OF NET AR
- Page 25 and 26: Gross Area Irrigated Gross area irr
- Page 27 and 28: COMPONENTS OF GROSS AREA SOWN 09-10
- Page 29 and 30: COMPONENTS OF FOODGRAIN 09-10 Black
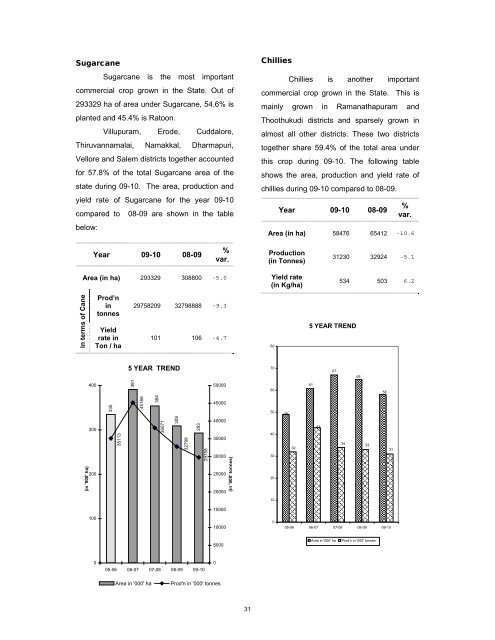
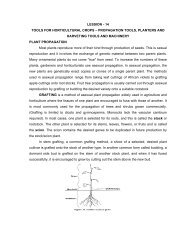
- Page 31 and 32: During the year 2009-10 the area un
- Page 33 and 34: Ragi The area under Ragi constitute
- Page 35: Redgram Redgram is sown mainly unde
- Page 39 and 40: Coconut Coconut is a perennial crop
- Page 41 and 42: The Production and Productivity of
- Page 43 and 44: RICE COMMON The monthly Average Who
- Page 45 and 46: 1.03 1.77 2.67 4.14 3.33 AREA AND P
- Page 47 and 48: SUMMARY TABLES B - SOURCES OF IRRIG
- Page 49 and 50: SUMMARY TABLES D . AREA , PRODUCTIO
- Page 51 and 52: SUMMARY TABLES E . AVERAGE YIELD AN
- Page 53 and 54: SUMMARY TABLES G - SEVEN SERIES OF
- Page 55 and 56: AREA UNDER AGRICULTURE CROPS - 2009
- Page 57 and 58: AREA UNDER AGRICULTURE CROPS - 2009
- Page 59 and 60: TABLE - I DISTRICTWISE - SEASONAL R
- Page 61 and 62: TABLE - I DISTRICTWISE - SEASONAL R
- Page 63 and 64: TABLE - I DISTRICTWISE - SEASONAL R
- Page 65 and 66: TABLE - II CLASSIFICATION OF LAND D
- Page 67 and 68: TABLE - II CLASSIFICATION OF LAND D
- Page 69 and 70: TABLE - III A NUMBER AND SOURCES OF
- Page 71 and 72: TABLE - III A NUMBER AND SOURCES OF
- Page 73 and 74: TABLE - III A NUMBER AND SOURCES OF
- Page 75 and 76: TABLE - III A NUMBER AND SOURCES OF
- Page 77 and 78: TABLE - III A NUMBER AND SOURCES OF
- Page 79 and 80: TABLE - III A NUMBER AND SOURCES OF
- Page 81 and 82: TABLE - III A NUMBER AND SOURCES OF
- Page 83 and 84: TABLE - III B AREA IRRIGATED BY DIF
- Page 85 and 86: TABLE - III B AREA IRRIGATED BY DIF
- Page 87 and 88:
TABLE - III B AREA IRRIGATED BY DIF
- Page 89 and 90:
TABLE - III B AREA IRRIGATED BY DIF
- Page 91 and 92:
TABLE - III C MASONRY AND NON-MASON
- Page 93 and 94:
TABLE - IV A AREA UNDER FOOD CROPS
- Page 95 and 96:
TABLE - IV A AREA UNDER FOOD CROPS
- Page 97 and 98:
TABLE - IV A AREA UNDER FOOD CROPS
- Page 99 and 100:
TABLE - IV A AREA UNDER FOOD CROPS
- Page 101 and 102:
TABLE - IV A AREA UNDER FOOD CROPS
- Page 103 and 104:
TABLE - IV A AREA UNDER FOOD CROPS
- Page 105 and 106:
TABLE - IV A AREA UNDER FOOD CROPS
- Page 107 and 108:
TABLE - IV A AREA UNDER FOOD CROPS
- Page 109 and 110:
TABLE - IV A AREA UNDER FOOD CROPS
- Page 111 and 112:
TABLE - IV A AREA UNDER FOOD CROPS
- Page 113 and 114:
TABLE - IV A AREA UNDER FOOD CROPS
- Page 115 and 116:
TABLE - IV A AREA UNDER FOOD CROPS
- Page 117 and 118:
TABLE - IV A AREA UNDER FOOD CROPS
- Page 119 and 120:
TABLE - IV A AREA UNDER FOOD CROPS
- Page 121 and 122:
TABLE - IV A AREA UNDER FOOD CROPS
- Page 123 and 124:
TABLE - IV A AREA UNDER FOOD CROPS
- Page 125 and 126:
TABLE - IV A AREA UNDER FOOD CROPS
- Page 127 and 128:
TABLE - IV A AREA UNDER FOOD CROPS
- Page 129 and 130:
TABLE - IV A AREA UNDER FOOD CROPS
- Page 131 and 132:
TABLE - IV A AREA UNDER FOOD CROPS
- Page 133 and 134:
TABLE - IV A AREA UNDER FOOD CROPS
- Page 135 and 136:
TABLE - IV A AREA UNDER FOOD CROPS
- Page 137 and 138:
TABLE - IV A AREA UNDER FOOD CROPS
- Page 139 and 140:
TABLE - IV A AREA UNDER FOOD CROPS
- Page 141 and 142:
TABLE - IV A AREA UNDER FOOD CROPS
- Page 143 and 144:
TABLE - IV A AREA UNDER FOOD CROPS
- Page 145 and 146:
TABLE - IV B AREA UNDER NON-FOOD CR
- Page 147 and 148:
TABLE - IV B AREA UNDER NON-FOOD CR
- Page 149 and 150:
TABLE - IV B AREA UNDER NON-FOOD CR
- Page 151 and 152:
TABLE - IV B AREA UNDER NON-FOOD CR
- Page 153 and 154:
TABLE - IV B AREA UNDER NON-FOOD CR
- Page 155 and 156:
TABLE - IV B AREA UNDER NON-FOOD CR
- Page 157 and 158:
TABLE - IV B AREA UNDER NON-FOOD CR
- Page 159 and 160:
TABLE - IV B AREA UNDER NON-FOOD CR
- Page 161 and 162:
TABLE - IV B AREA UNDER NON-FOOD CR
- Page 163 and 164:
TABLE - IV B AREA UNDER NON-FOOD CR
- Page 165 and 166:
TABLE - IV B AREA UNDER NON-FOOD CR
- Page 167 and 168:
TABLE - IV B AREA UNDER NON-FOOD CR
- Page 169 and 170:
TABLE - IV B AREA UNDER NON-FOOD CR
- Page 171 and 172:
TABLE - IV B AREA UNDER NON-FOOD CR
- Page 173 and 174:
TABLE - IV B AREA UNDER NON-FOOD CR
- Page 175 and 176:
TABLE - IV B AREA UNDER NON-FOOD CR
- Page 177 and 178:
TABLE - IV B AREA UNDER NON-FOOD CR
- Page 179 and 180:
TABLE - IV B AREA UNDER NON-FOOD CR
- Page 181 and 182:
TABLE - IV B AREA UNDER NON-FOOD CR
- Page 183 and 184:
TABLE - IV B AREA UNDER NON-FOOD CR
- Page 185 and 186:
TABLE - IV B AREA UNDER NON-FOOD CR
- Page 187 and 188:
TABLE - IV B AREA UNDER NON-FOOD CR
- Page 189 and 190:
TABLE - IV B AREA UNDER NON-FOOD CR
- Page 191 and 192:
TABLE - IV B AREA UNDER NON-FOOD CR
- Page 193 and 194:
TABLE - IV B AREA UNDER NON-FOOD CR
- Page 195 and 196:
TABLE - IV B AREA UNDER NON-FOOD CR
- Page 197 and 198:
TABLE - IV B AREA UNDER NON-FOOD CR
- Page 199 and 200:
TABLE - IV B AREA UNDER NON-FOOD CR
- Page 201 and 202:
TABLE - IV B AREA UNDER CROPS - 09-
- Page 203 and 204:
TABLE - IV C PERCENTAGE OF AREA UND
- Page 205 and 206:
Sl.no District food and non food cr
- Page 207 and 208:
Sl.no District % Green gram % Horse
- Page 209 and 210:
Sl.no District Spices & Condim ents
- Page 211 and 212:
Sl.no District Other Non Food Crops
- Page 213 and 214:
TABLE - IV D AREA UNDER HIGH YIELDI
- Page 215 and 216:
TABLE - IV D AREA UNDER HIGH YIELDI
- Page 217 and 218:
TABLE - IV D AREA UNDER HIGH YIELDI
- Page 219 and 220:
DISTRICT-WISE NORMAL AREA OF PRINCI
- Page 221 and 222:
7 Salem 4218 1289 1030 2374 2,561 1
- Page 223 and 224:
19 Thanjavur 83 3 86 43 20 Thiruvar
- Page 225 and 226:
31 Kanniyakumari 0 0 0 0 State 9954
- Page 227 and 228:
9 Dharmapuri 13179 12034 11952 1047
- Page 229 and 230:
21 Nagapatinam 0 0 0 0 22 Madurai 1
- Page 231 and 232:
BLACK GRAM Sl.no District 2005-06 2
- Page 233 and 234:
11 Coimbatore 28111 28946 25789 125
- Page 235 and 236:
23 Theni 4298 5206 4433 3376 3,163
- Page 237 and 238:
1 Kancheepuram 5 2 2 3 2 14 3 2 Thi
- Page 239 and 240:
13 Erode 2 2 1 5 2 14 Tiruchirapall
- Page 241 and 242:
25 Ramanathapuram 5 5 5 26 Virudhun
- Page 243 and 244:
3 Cuddallore 597 599 676 653 693 32
- Page 245 and 246:
15 Karur 76 93 106 179 454 114 16 P
- Page 247 and 248:
27 Sivagangai 284 133 893 253 208 1
- Page 249 and 250:
5 Vellore 89 58 275 491 145 1058 21
- Page 251 and 252:
17 Ariyalur 0 0 0 0 18 Pudukkottai
- Page 253 and 254:
29 Thoothukudi 35248 28978 27673 27
- Page 255 and 256:
TABLE - IV E NORMAL AREA OF PRINCIP
- Page 257 and 258:
TABLE - IV E NORMAL AREA OF PRINCIP
- Page 259 and 260:
TABLE - IV E NORMAL AREA OF PRINCIP
- Page 261 and 262:
TABLE - V A DISTRICTWISE AVERAGE YI
- Page 263 and 264:
TABLE - V A DISTRICTWISE AVERAGE YI
- Page 265 and 266:
TABLE - V A DISTRICTWISE AVERAGE YI
- Page 267 and 268:
TABLE - V A DISTRICTWISE AVERAGE YI
- Page 269 and 270:
TABLE - V B PRODUCTION OF CROPS DUR
- Page 271 and 272:
TABLE - V B PRODUCTION OF CROPS DUR
- Page 273 and 274:
TABLE - V B PRODUCTION OF CROPS DUR
- Page 275 and 276:
TABLE - V B PRODUCTION OF CROPS DUR
- Page 277 and 278:
DISTRICT-WISE NORMAL PRODUCTION OF
- Page 279 and 280:
7 Salem 15846 4,876 3,653 7,686 10,
- Page 281 and 282:
19 Thanjavur 150 5 155 78 20 Thiruv
- Page 283 and 284:
31 Kanyakumari 0 0 0 State 132172 1
- Page 285 and 286:
9 Dharmapuri 10569 15257 13974 8237
- Page 287 and 288:
21 Nagapattinam 0 0 0 22 Madurai 63
- Page 289 and 290:
BLACK GRAM Sl.no District 2005-06 2
- Page 291 and 292:
11 Coimbatore 2711 2744 2444 2171 1
- Page 293 and 294:
23 Theni 146 143 142 143 145 719 14
- Page 295 and 296:
1 Kancheepuram 0 0 0 2 Thiruvallur
- Page 297 and 298:
13 Erode 73 169 220 214 180 856 171
- Page 299 and 300:
25 Ramanathapuram 6 11 11 0 28 7 26
- Page 301 and 302:
3 Cuddalore 945 7119 402 180 102 87
- Page 303 and 304:
15 Karur 83720 105179 119814 91761
- Page 305 and 306:
27 Sivagangai 447 309 1027 520 359
- Page 307 and 308:
5 Vellore 87327 87957 103454 88329
- Page 309 and 310:
17 Ariyalur 148 148 148 18 Pudukott
- Page 311 and 312:
TABLE - V C NORMAL PRODUCTION OF PR
- Page 313 and 314:
TABLE - V C NORMAL PRODUCTION OF PR
- Page 315 and 316:
TABLE - V C NORMAL PRODUCTION OF PR
- Page 317 and 318:
TABLE - VI B INDEX NUMBER OF AGRICU
- Page 319 and 320:
TABLE - VII A FARM HARVEST PRICES (
- Page 321 and 322:
TABLE - VII A FARM HARVEST PRICES (
- Page 323 and 324:
TABLE VII - B MONTHLY - AVERAGE WHO
- Page 325 and 326:
TABLE - VII C CENTRE-WISE DISTRICT-
- Page 327 and 328:
TABLE - VII C CENTRE-WISE DISTRICT-
- Page 329 and 330:
TABLE - VIII TIME SERIES DATA ON LA
- Page 331 and 332:
TABLE - IX TIME SERIES DATA ON PRIN
- Page 333 and 334:
TABLE - IX TIME SERIES DATA ON PRIN
- Page 335 and 336:
TABLE - IX TIME SERIES DATA ON PRIN
- Page 337 and 338:
TABLE - IX TIME SERIES DATA ON PRIN
- Page 339 and 340:
TABLE X CROP FORECAST CALENDAR FINA
- Page 341 and 342:
TABLE XI PEAK SOWING AND HARVESTING
- Page 343 and 344:
TABLE XI (contd.) PEAK SOWING AND H
- Page 345 and 346:
TABLE XI (contd.) PEAK SOWING AND H
- Page 347 and 348:
TABLE XI (contd.) PEAK SOWING AND H
- Page 349 and 350:
TABLE XI (contd.) PEAK SOWING AND H
- Page 351 and 352:
TABLE XII GLOSSARY OF BOTANICAL, EN