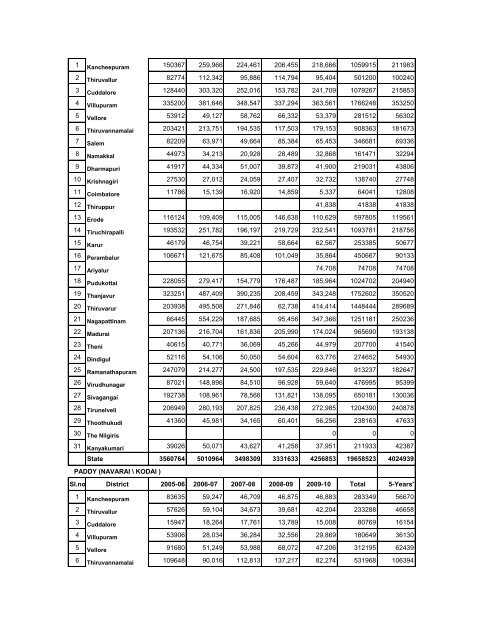
1 Kancheepuram 150367 259,966 224,461 206,455 218,666 <strong>10</strong>59915 211983 2 Thiruvallur 82774 112,342 95,886 114,794 95,404 501200 <strong>10</strong>0240 3 Cuddalore 128440 303,320 252,016 153,782 241,709 <strong>10</strong>79267 215853 4 Villupuram 335200 381,646 348,547 337,294 363,561 1766248 353250 5 Vellore 53912 49,127 58,762 66,332 53,379 281512 56302 6 Thiruvannamalai 203421 213,751 194,535 117,503 179,153 908363 181673 7 Salem 82209 63,971 49,664 85,384 65,453 346681 69336 8 Namakkal 44973 34,213 20,928 28,489 32,868 161471 32294 9 Dharmapuri 41917 44,334 51,007 39,873 41,900 219031 43806 <strong>10</strong> Krishnagiri 27530 27,012 24,059 27,407 32,732 138740 27748 11 Coimbatore 11786 15,139 16,920 14,859 5,337 64041 12808 12 Thiruppur 41,838 41838 41838 13 Erode 116124 <strong>10</strong>9,409 115,005 146,638 1<strong>10</strong>,629 597805 119561 14 Tiruchirapalli 193532 251,782 196,197 219,729 232,541 <strong>10</strong>93781 218756 15 Karur 46179 46,754 39,221 58,664 62,567 253385 50677 16 Perambalur <strong>10</strong>6671 121,675 85,408 <strong>10</strong>1,049 35,864 450667 90133 17 Ariyalur 74,708 74708 74708 18 Pudukottai 228055 279,417 154,779 176,487 185,964 <strong>10</strong>24702 204940 19 Thanjavur 323251 487,409 390,235 208,459 343,248 1752602 350520 20 Thiruvarur 203938 495,508 271,846 62,738 414,414 1448444 289689 21 Nagapattinam 66445 554,229 187,685 95,456 347,366 1251181 250236 22 Madurai 207136 216,704 161,836 205,990 174,024 965690 193138 23 Theni 40615 40,771 36,069 45,266 44,979 207700 41540 24 Dindigul 52116 54,<strong>10</strong>6 50,050 54,604 63,776 274652 54930 25 Ramanathapuram 247079 214,277 24,500 197,535 229,846 913237 182647 26 Virudhunagar 87021 148,896 84,5<strong>10</strong> 96,928 59,640 476995 95399 27 Sivagangai 192738 <strong>10</strong>8,961 78,566 131,821 138,095 650181 130036 28 Tirunelveli 206949 280,193 207,825 236,438 272,985 1204390 240878 29 Thoothukudi 41360 45,981 34,165 60,401 56,256 238163 47633 30 The Nilgiris 0 0 0 31 Kanyakumari 39026 50,071 43,627 41,258 37,951 211933 42387 State 3560764 50<strong>10</strong>964 3498309 3331633 4256853 19658523 4024939 PADDY (NAVARAI \ KODAI ) Sl.no District 2005-06 2006-07 2007-08 2008-09 <strong>2009</strong>-<strong>10</strong> Total 5-Years' 1 Kancheepuram 83635 59,247 46,709 46,875 46,883 283349 56670 2 Thiruvallur 57626 59,<strong>10</strong>4 34,673 39,681 42,204 233288 46658 3 Cuddalore 15947 18,264 17,761 13,789 15,008 80769 16154 4 Villupuram 53906 28,034 36,284 32,556 29,869 180649 36130 5 Vellore 91680 51,249 53,988 68,072 47,206 312195 62439 6 Thiruvannamalai <strong>10</strong>9648 90,016 112,813 137,217 82,274 531968 <strong>10</strong>6394
7 Salem 15846 4,876 3,653 7,686 <strong>10</strong>,627 42688 8538 8 Namakkal 3562 2,021 125 355 748 6811 1362 9 Dharmapuri 13969 8,121 4,469 5,167 8,364 40090 8018 <strong>10</strong> Krishnagiri 5070 3,494 2,311 3,093 4,416 18384 3677 11 Coimbatore 5243 3,826 1,346 4,171 144 14730 2946 12 Thiruppur 6,684 6684 6684 13 Erode 5097 4,292 3,580 8,793 5,412 27174 5435 14 Tiruchirapalli 21317 6,345 9,985 13,798 9,375 60820 12164 15 Karur 2046 1,518 1,058 1,494 1,478 7594 1519 16 Perambalur 3263 3,287 1,230 6,711 4,068 18559 3712 17 Ariyalur 1,208 1208 1208 18 Pudukottai 652 1,116 922 1,184 1,025 4899 980 19 Thanjavur 8188 6,900 11,359 14,027 17,393 57867 11573 20 Thiruvarur 11965 6,578 7,228 14,521 27,163 67455 13491 21 Nagapattinam 3706 3,340 85 2,343 2,770 12244 2449 22 Madurai 7545 14,820 11,932 13,529 14,267 62093 12419 23 Theni 655 827 813 2,926 2,348 7569 1514 24 Dindigul 15144 16,436 8,971 12,252 7,600 60403 12081 25 Ramanathapuram 7,957 5,379 5,454 5,034 23824 5956 26 Virudhunagar 11461 9,318 8,541 6,664 5,076 4<strong>10</strong>60 8212 27 Sivagangai 373 <strong>10</strong>2 0 475 158 28 Tirunelveli 32205 17,271 11,041 27,072 7,468 95057 19011 29 Thoothukudi 7892 16,351 4,607 6,036 5,911 40797 8159 30 The Nilgiris 0 0 0 31 Kanyakumari 0 0 0 State 587268 444608 401236 495568 412023 2340703 475711 MAIZE Sl.no District 2005-06 2006-07 2007-08 2008-09 <strong>2009</strong>-<strong>10</strong> Total 5-Years' 1 Kancheepuram 27 13 27 0 67 17 2 Thiruvallur 16 3 19 <strong>10</strong> 3 Cuddalore 9716 20,383 25,314 21,720 21,642 98775 19755 4 Villupuram 2035 5,954 12,739 28,390 17,527 66645 13329 5 Vellore 334 1,7<strong>10</strong> 1,970 2,722 2,528 9264 1853 6 Thiruvannamalai 263 548 850 23,971 2,719 28351 5670 7 Salem 19068 30,187 43,405 96,374 121,754 3<strong>10</strong>788 62158 8 Namakkal 2284 14,053 24,088 43,589 27,470 111484 22297 9 Dharmapuri 235 1,308 1,540 2,129 2,372 7584 1517 <strong>10</strong> Krishnagiri 117 518 429 284 542 1890 378 11 Coimbatore 25864 115,949 111,874 146,154 28,486 428327 85665 12 Thiruppur 179,078 179078 179078
- Page 1 and 2:
R.No. 6 / 2011 SEASON AND CROP REPO
- Page 3 and 4:
Crop wise area and land use pattern
- Page 5 and 6:
IV Area Under Crops Contents Page A
- Page 7 and 8:
Considering the area irrigated unde
- Page 9 and 10:
Winter Season (Jan ’10 & Feb’10
- Page 11 and 12:
2. Agro Climatic Zones in Tamil Nad
- Page 13 and 14:
CLASSIFICATION OF LAND AREA 09-10 F
- Page 15 and 16:
Misc.Tree Crops and Groves not incl
- Page 17 and 18:
Gross Area Sown The Gross area sown
- Page 19 and 20:
SOURCEWISE NET AREA IRRIGATED 09-10
- Page 21 and 22:
WATER LEVELS OF IMPORTANT RESERVOIR
- Page 23 and 24:
DISTRICTWISE DISTRIBUTION OF NET AR
- Page 25 and 26:
Gross Area Irrigated Gross area irr
- Page 27 and 28:
COMPONENTS OF GROSS AREA SOWN 09-10
- Page 29 and 30:
COMPONENTS OF FOODGRAIN 09-10 Black
- Page 31 and 32:
During the year 2009-10 the area un
- Page 33 and 34:
Ragi The area under Ragi constitute
- Page 35 and 36:
Redgram Redgram is sown mainly unde
- Page 37 and 38:
Potato Potato is a major vegetable
- Page 39 and 40:
Coconut Coconut is a perennial crop
- Page 41 and 42:
The Production and Productivity of
- Page 43 and 44:
RICE COMMON The monthly Average Who
- Page 45 and 46:
1.03 1.77 2.67 4.14 3.33 AREA AND P
- Page 47 and 48:
SUMMARY TABLES B - SOURCES OF IRRIG
- Page 49 and 50:
SUMMARY TABLES D . AREA , PRODUCTIO
- Page 51 and 52:
SUMMARY TABLES E . AVERAGE YIELD AN
- Page 53 and 54:
SUMMARY TABLES G - SEVEN SERIES OF
- Page 55 and 56:
AREA UNDER AGRICULTURE CROPS - 2009
- Page 57 and 58:
AREA UNDER AGRICULTURE CROPS - 2009
- Page 59 and 60:
TABLE - I DISTRICTWISE - SEASONAL R
- Page 61 and 62:
TABLE - I DISTRICTWISE - SEASONAL R
- Page 63 and 64:
TABLE - I DISTRICTWISE - SEASONAL R
- Page 65 and 66:
TABLE - II CLASSIFICATION OF LAND D
- Page 67 and 68:
TABLE - II CLASSIFICATION OF LAND D
- Page 69 and 70:
TABLE - III A NUMBER AND SOURCES OF
- Page 71 and 72:
TABLE - III A NUMBER AND SOURCES OF
- Page 73 and 74:
TABLE - III A NUMBER AND SOURCES OF
- Page 75 and 76:
TABLE - III A NUMBER AND SOURCES OF
- Page 77 and 78:
TABLE - III A NUMBER AND SOURCES OF
- Page 79 and 80:
TABLE - III A NUMBER AND SOURCES OF
- Page 81 and 82:
TABLE - III A NUMBER AND SOURCES OF
- Page 83 and 84:
TABLE - III B AREA IRRIGATED BY DIF
- Page 85 and 86:
TABLE - III B AREA IRRIGATED BY DIF
- Page 87 and 88:
TABLE - III B AREA IRRIGATED BY DIF
- Page 89 and 90:
TABLE - III B AREA IRRIGATED BY DIF
- Page 91 and 92:
TABLE - III C MASONRY AND NON-MASON
- Page 93 and 94:
TABLE - IV A AREA UNDER FOOD CROPS
- Page 95 and 96:
TABLE - IV A AREA UNDER FOOD CROPS
- Page 97 and 98:
TABLE - IV A AREA UNDER FOOD CROPS
- Page 99 and 100:
TABLE - IV A AREA UNDER FOOD CROPS
- Page 101 and 102:
TABLE - IV A AREA UNDER FOOD CROPS
- Page 103 and 104:
TABLE - IV A AREA UNDER FOOD CROPS
- Page 105 and 106:
TABLE - IV A AREA UNDER FOOD CROPS
- Page 107 and 108:
TABLE - IV A AREA UNDER FOOD CROPS
- Page 109 and 110:
TABLE - IV A AREA UNDER FOOD CROPS
- Page 111 and 112:
TABLE - IV A AREA UNDER FOOD CROPS
- Page 113 and 114:
TABLE - IV A AREA UNDER FOOD CROPS
- Page 115 and 116:
TABLE - IV A AREA UNDER FOOD CROPS
- Page 117 and 118:
TABLE - IV A AREA UNDER FOOD CROPS
- Page 119 and 120:
TABLE - IV A AREA UNDER FOOD CROPS
- Page 121 and 122:
TABLE - IV A AREA UNDER FOOD CROPS
- Page 123 and 124:
TABLE - IV A AREA UNDER FOOD CROPS
- Page 125 and 126:
TABLE - IV A AREA UNDER FOOD CROPS
- Page 127 and 128:
TABLE - IV A AREA UNDER FOOD CROPS
- Page 129 and 130:
TABLE - IV A AREA UNDER FOOD CROPS
- Page 131 and 132:
TABLE - IV A AREA UNDER FOOD CROPS
- Page 133 and 134:
TABLE - IV A AREA UNDER FOOD CROPS
- Page 135 and 136:
TABLE - IV A AREA UNDER FOOD CROPS
- Page 137 and 138:
TABLE - IV A AREA UNDER FOOD CROPS
- Page 139 and 140:
TABLE - IV A AREA UNDER FOOD CROPS
- Page 141 and 142:
TABLE - IV A AREA UNDER FOOD CROPS
- Page 143 and 144:
TABLE - IV A AREA UNDER FOOD CROPS
- Page 145 and 146:
TABLE - IV B AREA UNDER NON-FOOD CR
- Page 147 and 148:
TABLE - IV B AREA UNDER NON-FOOD CR
- Page 149 and 150:
TABLE - IV B AREA UNDER NON-FOOD CR
- Page 151 and 152:
TABLE - IV B AREA UNDER NON-FOOD CR
- Page 153 and 154:
TABLE - IV B AREA UNDER NON-FOOD CR
- Page 155 and 156:
TABLE - IV B AREA UNDER NON-FOOD CR
- Page 157 and 158:
TABLE - IV B AREA UNDER NON-FOOD CR
- Page 159 and 160:
TABLE - IV B AREA UNDER NON-FOOD CR
- Page 161 and 162:
TABLE - IV B AREA UNDER NON-FOOD CR
- Page 163 and 164:
TABLE - IV B AREA UNDER NON-FOOD CR
- Page 165 and 166:
TABLE - IV B AREA UNDER NON-FOOD CR
- Page 167 and 168:
TABLE - IV B AREA UNDER NON-FOOD CR
- Page 169 and 170:
TABLE - IV B AREA UNDER NON-FOOD CR
- Page 171 and 172:
TABLE - IV B AREA UNDER NON-FOOD CR
- Page 173 and 174:
TABLE - IV B AREA UNDER NON-FOOD CR
- Page 175 and 176:
TABLE - IV B AREA UNDER NON-FOOD CR
- Page 177 and 178:
TABLE - IV B AREA UNDER NON-FOOD CR
- Page 179 and 180:
TABLE - IV B AREA UNDER NON-FOOD CR
- Page 181 and 182:
TABLE - IV B AREA UNDER NON-FOOD CR
- Page 183 and 184:
TABLE - IV B AREA UNDER NON-FOOD CR
- Page 185 and 186:
TABLE - IV B AREA UNDER NON-FOOD CR
- Page 187 and 188:
TABLE - IV B AREA UNDER NON-FOOD CR
- Page 189 and 190:
TABLE - IV B AREA UNDER NON-FOOD CR
- Page 191 and 192:
TABLE - IV B AREA UNDER NON-FOOD CR
- Page 193 and 194:
TABLE - IV B AREA UNDER NON-FOOD CR
- Page 195 and 196:
TABLE - IV B AREA UNDER NON-FOOD CR
- Page 197 and 198:
TABLE - IV B AREA UNDER NON-FOOD CR
- Page 199 and 200:
TABLE - IV B AREA UNDER NON-FOOD CR
- Page 201 and 202:
TABLE - IV B AREA UNDER CROPS - 09-
- Page 203 and 204:
TABLE - IV C PERCENTAGE OF AREA UND
- Page 205 and 206:
Sl.no District food and non food cr
- Page 207 and 208:
Sl.no District % Green gram % Horse
- Page 209 and 210:
Sl.no District Spices & Condim ents
- Page 211 and 212:
Sl.no District Other Non Food Crops
- Page 213 and 214:
TABLE - IV D AREA UNDER HIGH YIELDI
- Page 215 and 216:
TABLE - IV D AREA UNDER HIGH YIELDI
- Page 217 and 218:
TABLE - IV D AREA UNDER HIGH YIELDI
- Page 219 and 220:
DISTRICT-WISE NORMAL AREA OF PRINCI
- Page 221 and 222:
7 Salem 4218 1289 1030 2374 2,561 1
- Page 223 and 224:
19 Thanjavur 83 3 86 43 20 Thiruvar
- Page 225 and 226:
31 Kanniyakumari 0 0 0 0 State 9954
- Page 227 and 228: 9 Dharmapuri 13179 12034 11952 1047
- Page 229 and 230: 21 Nagapatinam 0 0 0 0 22 Madurai 1
- Page 231 and 232: BLACK GRAM Sl.no District 2005-06 2
- Page 233 and 234: 11 Coimbatore 28111 28946 25789 125
- Page 235 and 236: 23 Theni 4298 5206 4433 3376 3,163
- Page 237 and 238: 1 Kancheepuram 5 2 2 3 2 14 3 2 Thi
- Page 239 and 240: 13 Erode 2 2 1 5 2 14 Tiruchirapall
- Page 241 and 242: 25 Ramanathapuram 5 5 5 26 Virudhun
- Page 243 and 244: 3 Cuddallore 597 599 676 653 693 32
- Page 245 and 246: 15 Karur 76 93 106 179 454 114 16 P
- Page 247 and 248: 27 Sivagangai 284 133 893 253 208 1
- Page 249 and 250: 5 Vellore 89 58 275 491 145 1058 21
- Page 251 and 252: 17 Ariyalur 0 0 0 0 18 Pudukkottai
- Page 253 and 254: 29 Thoothukudi 35248 28978 27673 27
- Page 255 and 256: TABLE - IV E NORMAL AREA OF PRINCIP
- Page 257 and 258: TABLE - IV E NORMAL AREA OF PRINCIP
- Page 259 and 260: TABLE - IV E NORMAL AREA OF PRINCIP
- Page 261 and 262: TABLE - V A DISTRICTWISE AVERAGE YI
- Page 263 and 264: TABLE - V A DISTRICTWISE AVERAGE YI
- Page 265 and 266: TABLE - V A DISTRICTWISE AVERAGE YI
- Page 267 and 268: TABLE - V A DISTRICTWISE AVERAGE YI
- Page 269 and 270: TABLE - V B PRODUCTION OF CROPS DUR
- Page 271 and 272: TABLE - V B PRODUCTION OF CROPS DUR
- Page 273 and 274: TABLE - V B PRODUCTION OF CROPS DUR
- Page 275 and 276: TABLE - V B PRODUCTION OF CROPS DUR
- Page 277: DISTRICT-WISE NORMAL PRODUCTION OF
- Page 281 and 282: 19 Thanjavur 150 5 155 78 20 Thiruv
- Page 283 and 284: 31 Kanyakumari 0 0 0 State 132172 1
- Page 285 and 286: 9 Dharmapuri 10569 15257 13974 8237
- Page 287 and 288: 21 Nagapattinam 0 0 0 22 Madurai 63
- Page 289 and 290: BLACK GRAM Sl.no District 2005-06 2
- Page 291 and 292: 11 Coimbatore 2711 2744 2444 2171 1
- Page 293 and 294: 23 Theni 146 143 142 143 145 719 14
- Page 295 and 296: 1 Kancheepuram 0 0 0 2 Thiruvallur
- Page 297 and 298: 13 Erode 73 169 220 214 180 856 171
- Page 299 and 300: 25 Ramanathapuram 6 11 11 0 28 7 26
- Page 301 and 302: 3 Cuddalore 945 7119 402 180 102 87
- Page 303 and 304: 15 Karur 83720 105179 119814 91761
- Page 305 and 306: 27 Sivagangai 447 309 1027 520 359
- Page 307 and 308: 5 Vellore 87327 87957 103454 88329
- Page 309 and 310: 17 Ariyalur 148 148 148 18 Pudukott
- Page 311 and 312: TABLE - V C NORMAL PRODUCTION OF PR
- Page 313 and 314: TABLE - V C NORMAL PRODUCTION OF PR
- Page 315 and 316: TABLE - V C NORMAL PRODUCTION OF PR
- Page 317 and 318: TABLE - VI B INDEX NUMBER OF AGRICU
- Page 319 and 320: TABLE - VII A FARM HARVEST PRICES (
- Page 321 and 322: TABLE - VII A FARM HARVEST PRICES (
- Page 323 and 324: TABLE VII - B MONTHLY - AVERAGE WHO
- Page 325 and 326: TABLE - VII C CENTRE-WISE DISTRICT-
- Page 327 and 328: TABLE - VII C CENTRE-WISE DISTRICT-
- Page 329 and 330:
TABLE - VIII TIME SERIES DATA ON LA
- Page 331 and 332:
TABLE - IX TIME SERIES DATA ON PRIN
- Page 333 and 334:
TABLE - IX TIME SERIES DATA ON PRIN
- Page 335 and 336:
TABLE - IX TIME SERIES DATA ON PRIN
- Page 337 and 338:
TABLE - IX TIME SERIES DATA ON PRIN
- Page 339 and 340:
TABLE X CROP FORECAST CALENDAR FINA
- Page 341 and 342:
TABLE XI PEAK SOWING AND HARVESTING
- Page 343 and 344:
TABLE XI (contd.) PEAK SOWING AND H
- Page 345 and 346:
TABLE XI (contd.) PEAK SOWING AND H
- Page 347 and 348:
TABLE XI (contd.) PEAK SOWING AND H
- Page 349 and 350:
TABLE XI (contd.) PEAK SOWING AND H
- Page 351 and 352:
TABLE XII GLOSSARY OF BOTANICAL, EN