Financial Statements 2011 - Investing In Africa
Financial Statements 2011 - Investing In Africa
Financial Statements 2011 - Investing In Africa

You also want an ePaper? Increase the reach of your titles
YUMPU automatically turns print PDFs into web optimized ePapers that Google loves.
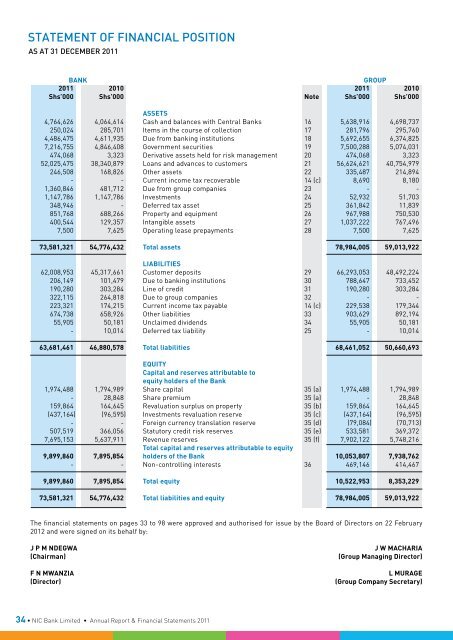
Statement Of <strong>Financial</strong> Position<br />
AS AT 31 DECEMBER <strong>2011</strong><br />
Bank<br />
Group<br />
<strong>2011</strong> 2010 <strong>2011</strong> 2010<br />
Shs’000 Shs’000 Note Shs’000 Shs’000<br />
ASSETS<br />
4,764,626 4,064,614 Cash and balances with Central Banks 16 5,638,916 4,698,737<br />
250,024 285,701 Items in the course of collection 17 281,796 295,760<br />
4,486,475 4,611,935 Due from banking institutions 18 5,692,655 6,374,825<br />
7,216,755 4,846,408 Government securities 19 7,500,288 5,074,031<br />
474,068 3,323 Derivative assets held for risk management 20 474,068 3,323<br />
52,025,475 38,340,879 Loans and advances to customers 21 56,624,621 40,754,979<br />
246,508 168,826 Other assets 22 335,487 214,894<br />
- - Current income tax recoverable 14 (c) 8,690 8,180<br />
1,360,846 481,712 Due from group companies 23 - -<br />
1,147,786 1,147,786 <strong>In</strong>vestments 24 52,932 51,703<br />
348,946 - Deferred tax asset 25 361,842 11,839<br />
851,768 688,266 Property and equipment 26 967,988 750,530<br />
400,544 129,357 <strong>In</strong>tangible assets 27 1,037,222 767,496<br />
7,500 7,625 Operating lease prepayments 28 7,500 7,625<br />
73,581,321 54,776,432 Total assets 78,984,005 59,013,922<br />
LIABILITIES<br />
62,008,953 45,317,661 Customer deposits 29 66,293,053 48,492,224<br />
206,149 101,479 Due to banking institutions 30 788,647 733,452<br />
190,280 303,284 Line of credit 31 190,280 303,284<br />
322,115 264,818 Due to group companies 32 - -<br />
223,321 174,215 Current income tax payable 14 (c) 229,538 179,344<br />
674,738 658,926 Other liabilities 33 903,629 892,194<br />
55,905 50,181 Unclaimed dividends 34 55,905 50,181<br />
- 10,014 Deferred tax liability 25 - 10,014<br />
63,681,461 46,880,578 Total liabilities 68,461,052 50,660,693<br />
EQUITY<br />
Capital and reserves attributable to<br />
equity holders of the Bank<br />
1,974,488 1,794,989 Share capital 35 (a) 1,974,488 1,794,989<br />
- 28,848 Share premium 35 (a) - 28,848<br />
159,864 164,645 Revaluation surplus on property 35 (b) 159,864 164,645<br />
(437,164) (96,595) <strong>In</strong>vestments revaluation reserve 35 (c) (437,164) (96,595)<br />
- - Foreign currency translation reserve 35 (d) (79,084) (70,713)<br />
507,519 366,056 Statutory credit risk reserves 35 (e) 533,581 369,372<br />
7,695,153 5,637,911 Revenue reserves 35 (f) 7,902,122 5,748,216<br />
Total capital and reserves attributable to equity<br />
9,899,860 7,895,854 holders of the Bank 10,053,807 7,938,762<br />
- - Non-controlling interests 36 469,146 414,467<br />
9,899,860 7,895,854 Total equity 10,522,953 8,353,229<br />
73,581,321 54,776,432 Total liabilities and equity 78,984,005 59,013,922<br />
The financial statements on pages 33 to 98 were approved and authorised for issue by the Board of Directors on 22 February<br />
2012 and were signed on its behalf by:<br />
J P M NDEGWA<br />
(Chairman)<br />
F N MWANZIA<br />
(Director)<br />
J W MACHARIA<br />
(Group Managing Director)<br />
L MURAGE<br />
(Group Company Secretary)<br />
34 • NIC Bank Limited • Annual Report & <strong>Financial</strong> <strong>Statements</strong> <strong>2011</strong>