Financial Statements 2011 - Investing In Africa
Financial Statements 2011 - Investing In Africa
Financial Statements 2011 - Investing In Africa

You also want an ePaper? Increase the reach of your titles
YUMPU automatically turns print PDFs into web optimized ePapers that Google loves.
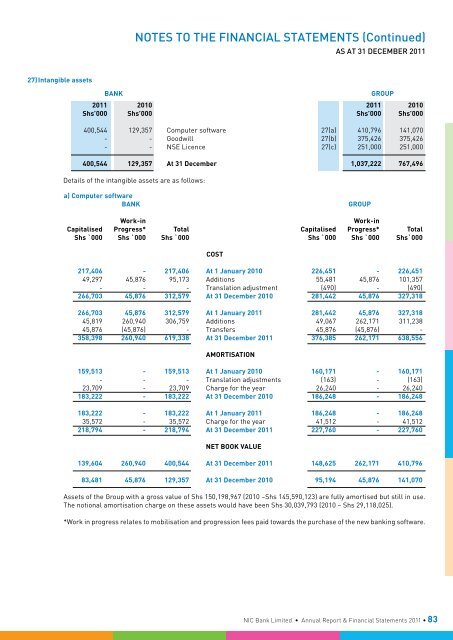
Notes To The <strong>Financial</strong> <strong>Statements</strong> (Continued)<br />
As at 31 december <strong>2011</strong><br />
27) <strong>In</strong>tangible assets<br />
Bank<br />
Group<br />
<strong>2011</strong> 2010 <strong>2011</strong> 2010<br />
Shs’000 Shs’000 Shs’000 Shs’000<br />
400,544 129,357 Computer software 27(a) 410,796 141,070<br />
- - Goodwill 27(b) 375,426 375,426<br />
- - NSE Licence 27(c) 251,000 251,000<br />
400,544 129,357 At 31 December 1,037,222 767,496<br />
Details of the intangible assets are as follows:<br />
a) Computer software<br />
Bank<br />
Group<br />
Work-in<br />
Work-in<br />
Capitalised Progress* Total Capitalised Progress* Total<br />
Shs `000 Shs `000 Shs `000 Shs `000 Shs `000 Shs`000<br />
COST<br />
217,406 - 217,406 At 1 January 2010 226,451 - 226,451<br />
49,297 45,876 95,173 Additions 55,481 45,876 101,357<br />
- - - Translation adjustment (490) - (490)<br />
266,703 45,876 312,579 At 31 December 2010 281,442 45,876 327,318<br />
266,703 45,876 312,579 At 1 January <strong>2011</strong> 281,442 45,876 327,318<br />
45,819 260,940 306,759 Additions 49,067 262,171 311,238<br />
45,876 (45,876) - Transfers 45,876 (45,876) -<br />
358,398 260,940 619,338 At 31 December <strong>2011</strong> 376,385 262,171 638,556<br />
AMORTISATION<br />
159,513 - 159,513 At 1 January 2010 160,171 - 160,171<br />
- - - Translation adjustments (163) - (163)<br />
23,709 - 23,709 Charge for the year 26,240 - 26,240<br />
183,222 - 183,222 At 31 December 2010 186,248 - 186,248<br />
183,222 - 183,222 At 1 January <strong>2011</strong> 186,248 - 186,248<br />
35,572 - 35,572 Charge for the year 41,512 - 41,512<br />
218,794 - 218,794 At 31 December <strong>2011</strong> 227,760 - 227,760<br />
Net Book Value<br />
139,604 260,940 400,544 At 31 December <strong>2011</strong> 148,625 262,171 410,796<br />
83,481 45,876 129,357 At 31 December 2010 95,194 45,876 141,070<br />
Assets of the Group with a gross value of Shs 150,198,967 (2010 –Shs 145,590,123) are fully amortised but still in use.<br />
The notional amortisation charge on these assets would have been Shs 30,039,793 (2010 – Shs 29,118,025).<br />
*Work in progress relates to mobilisation and progression fees paid towards the purchase of the new banking software.<br />
NIC Bank Limited • Annual Report & <strong>Financial</strong> <strong>Statements</strong> <strong>2011</strong> • 83