Financial Statements 2011 - Investing In Africa
Financial Statements 2011 - Investing In Africa
Financial Statements 2011 - Investing In Africa

You also want an ePaper? Increase the reach of your titles
YUMPU automatically turns print PDFs into web optimized ePapers that Google loves.
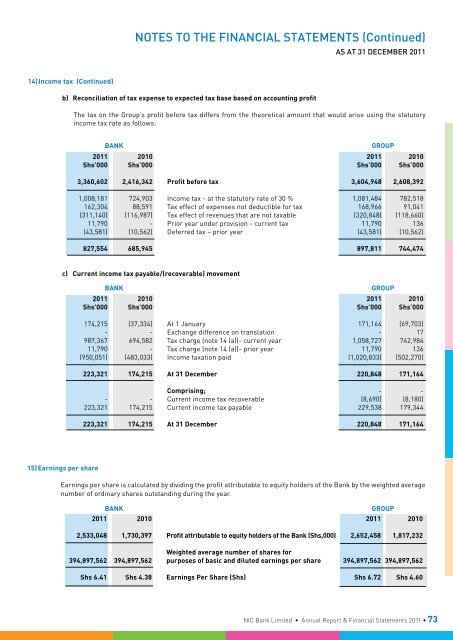
Notes To The <strong>Financial</strong> <strong>Statements</strong> (Continued)<br />
As at 31 december <strong>2011</strong><br />
14) <strong>In</strong>come tax (Continued)<br />
b) Reconciliation of tax expense to expected tax base based on accounting profit<br />
The tax on the Group’s profit before tax differs from the theoretical amount that would arise using the statutory<br />
income tax rate as follows:<br />
Bank<br />
Group<br />
<strong>2011</strong> 2010 <strong>2011</strong> 2010<br />
Shs’000 Shs’000 Shs’000 Shs’000<br />
3,360,602 2,416,342 Profit before tax 3,604,948 2,608,392<br />
1,008,181 724,903 <strong>In</strong>come tax - at the statutory rate of 30 % 1,081,484 782,518<br />
162,304 88,591 Tax effect of expenses not deductible for tax 168,966 91,041<br />
(311,140) (116,987) Tax effect of revenues that are not taxable (320,848) (118,660)<br />
11,790 - Prior year under provision - current tax 11,790 136<br />
(43,581) (10,562) Deferred tax – prior year (43,581) (10,562)<br />
827,554 685,945 897,811 744,474<br />
c) Current income tax payable/(recoverable) movement<br />
Bank<br />
Group<br />
<strong>2011</strong> 2010 <strong>2011</strong> 2010<br />
Shs’000 Shs’000 Shs’000 Shs’000<br />
174,215 (37,334) At 1 January 171,164 (69,703)<br />
- - Exchange difference on translation - 17<br />
987,367 694,582 Tax charge (note 14 (a))- current year 1,058,727 742,984<br />
11,790 - Tax charge (note 14 (a))- prior year 11,790 136<br />
(950,051) (483,033) <strong>In</strong>come taxation paid (1,020,833) (502,270)<br />
223,321 174,215 At 31 December 220,848 171,164<br />
Comprising; - -<br />
- - Current income tax recoverable (8,690) (8,180)<br />
223,321 174,215 Current income tax payable 229,538 179,344<br />
223,321 174,215 At 31 December 220,848 171,164<br />
15) Earnings per share<br />
Earnings per share is calculated by dividing the profit attributable to equity holders of the Bank by the weighted average<br />
number of ordinary shares outstanding during the year.<br />
Bank<br />
Group<br />
<strong>2011</strong> 2010 <strong>2011</strong> 2010<br />
2,533,048 1,730,397 Profit attributable to equity holders of the Bank (Shs,000) 2,652,458 1,817,232<br />
Weighted average number of shares for<br />
394,897,562 394,897,562 purposes of basic and diluted earnings per share 394,897,562 394,897,562<br />
Shs 6.41 Shs 4.38 Earnings Per Share (Shs) Shs 6.72 Shs 4.60<br />
NIC Bank Limited • Annual Report & <strong>Financial</strong> <strong>Statements</strong> <strong>2011</strong> • 73