- Page 1 and 2: Master’s Thesis Quantitative Meas
- Page 3 and 4: I hereby certify that the work pres
- Page 5 and 6: Kurzfassung In dieser Arbeit werden
- Page 7 and 8: CONTENTS 4.2.2 Noise Suppression .
- Page 9 and 10: Chapter 1 Introduction Assessment o
- Page 11 and 12: Figure 1.1: This workflow diagram d
- Page 13 and 14: Chapter 2 Visualization Visualizati
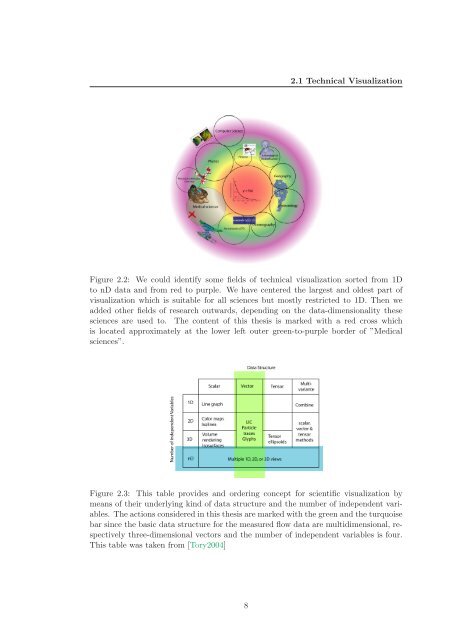
- Page 15: 2.1 Technical Visualization (a) (b)
- Page 19 and 20: 2.1 Technical Visualization Figure
- Page 21 and 22: 2.1 Technical Visualization • ave
- Page 23 and 24: 2.1 Technical Visualization spaced
- Page 25 and 26: 2.1 Technical Visualization Figure
- Page 27 and 28: 2.1 Technical Visualization improve
- Page 29 and 30: 2.1 Technical Visualization try to
- Page 31 and 32: 2.1 Technical Visualization Visuali
- Page 33 and 34: 2.1 Technical Visualization Figure
- Page 35 and 36: 2.1 Technical Visualization of N.
- Page 37 and 38: 2.2 Advanced Graphics Processing ap
- Page 39 and 40: 2.2 Advanced Graphics Processing pr
- Page 41 and 42: 2.2 Advanced Graphics Processing te
- Page 43 and 44: Chapter 3 Magnetic Resonance Imagin
- Page 45 and 46: 3.1 Magnetic Field and Magnetizatio
- Page 47 and 48: 3.1 Magnetic Field and Magnetizatio
- Page 49 and 50: 3.2 Excitation of Magnetized Matter
- Page 51 and 52: 3.2 Excitation of Magnetized Matter
- Page 53 and 54: 3.3 Signal localization 1. A gradie
- Page 55 and 56: 3.3 Signal localization in one dire
- Page 57 and 58: 3.3 Signal localization a commonly
- Page 59 and 60: 3.4 Image Contrast (a) T1-contrast
- Page 61 and 62: 3.5 Cine Cardiac Fast Low-Angle Sho
- Page 63 and 64: 3.5 Cine Cardiac Fast Low-Angle Sho
- Page 65 and 66: 3.5 Cine Cardiac Fast Low-Angle Sho
- Page 67 and 68:
3.5 Cine Cardiac Fast Low-Angle Sho
- Page 69 and 70:
3.5 Cine Cardiac Fast Low-Angle Sho
- Page 71 and 72:
4.1 Requirements visualization of c
- Page 73 and 74:
4.2 Data Preprocessing 4.2 Data Pre
- Page 75 and 76:
4.2 Data Preprocessing and if ∆v
- Page 77 and 78:
4.3 Intermediate File Format a simp
- Page 79 and 80:
4.4 Visualization Framework impleme
- Page 81 and 82:
4.4 Visualization Framework hardwar
- Page 83 and 84:
4.4 Visualization Framework 3 void
- Page 85 and 86:
4.4 Visualization Framework • fra
- Page 87 and 88:
4.4 Visualization Framework Figure
- Page 89 and 90:
Chapter 5 Implementation This chapt
- Page 91 and 92:
5.2 iMEDgine extensions Figure 5.1:
- Page 93 and 94:
5.2 iMEDgine extensions which eases
- Page 95 and 96:
5.2 iMEDgine extensions solution fu
- Page 97 and 98:
5.2 iMEDgine extensions 23 cam_posi
- Page 99 and 100:
5.2 iMEDgine extensions Figure 5.4:
- Page 101 and 102:
5.2 iMEDgine extensions • SoSFStr
- Page 103 and 104:
5.2 iMEDgine extensions 6 Z=" -238.
- Page 105 and 106:
5.3 Visualization nodes and subgrap
- Page 107 and 108:
5.3 Visualization nodes and subgrap
- Page 109 and 110:
5.3 Visualization nodes and subgrap
- Page 111 and 112:
5.3 Visualization nodes and subgrap
- Page 113 and 114:
5.3 Visualization nodes and subgrap
- Page 115 and 116:
5.3 Visualization nodes and subgrap
- Page 117 and 118:
5.3 Visualization nodes and subgrap
- Page 119 and 120:
5.3 Visualization nodes and subgrap
- Page 121 and 122:
Chapter 6 Experiments Several atten
- Page 123 and 124:
6.3 Results 6.3 Results To complete
- Page 125 and 126:
6.4 Scalability activity. The highe
- Page 127 and 128:
6.4 Scalability (a) Stream lines fo
- Page 129 and 130:
6.4 Scalability (a) Stream tubes ap
- Page 131 and 132:
6.4 Scalability Figure 6.10: Compar
- Page 133 and 134:
Chapter 7 Future Work This chapter
- Page 135 and 136:
7.3 Derived Magnitudes possibilitie
- Page 137 and 138:
7.5 Clinical Evaluations (a) Stereo
- Page 139 and 140:
Beside the improvement of known spa
- Page 141 and 142:
Appendix A Intermediate File Format
- Page 143 and 144:
A.2 Data Files Offset Name Type Des
- Page 145 and 146:
A.2 Data Files Offset Name Type Des
- Page 147 and 148:
A.2 Data Files Offset Name Type Des
- Page 149 and 150:
This chapter supplements chapter 5
- Page 151 and 152:
143 Figure B.3: An thinned out UML
- Page 153 and 154:
Figure B.5: This UML class diagram
- Page 155 and 156:
Glossary Notation bipolar gradient
- Page 157 and 158:
Glossary Notation Description MIP M
- Page 159 and 160:
Glossary Notation Description shade
- Page 161 and 162:
LIST OF FIGURES 3.5 The slice-profi
- Page 163 and 164:
List of Tables 2.1 CPU - GPU analog
- Page 165 and 166:
REFERENCES [Brill1994] M. Brill, W.
- Page 167 and 168:
REFERENCES [iMedgine2006] T. Gross,
- Page 169 and 170:
REFERENCES [Kniss2002a] Joe Kniss,
- Page 171 and 172:
REFERENCES [Markl2003] Michael Mark
- Page 173 and 174:
REFERENCES [Roth1982] Scott D. Roth
- Page 175 and 176:
REFERENCES [Vivek1999] andAlexPang
- Page 177 and 178:
INDEX flow data, 135 format definit