Master's Thesis - Studierstube Augmented Reality Project - Graz ...
Master's Thesis - Studierstube Augmented Reality Project - Graz ...
Master's Thesis - Studierstube Augmented Reality Project - Graz ...

Create successful ePaper yourself
Turn your PDF publications into a flip-book with our unique Google optimized e-Paper software.
2.1 Technical Visualization<br />
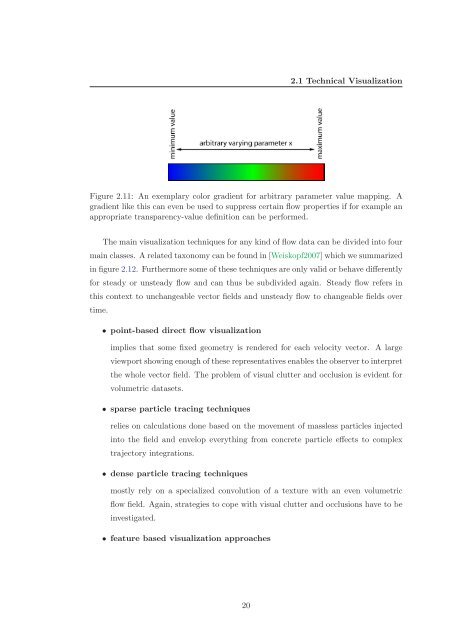
Figure 2.11: An exemplary color gradient for arbitrary parameter value mapping. A<br />
gradient like this can even be used to suppress certain flow properties if for example an<br />
appropriate transparency-value definition can be performed.<br />
The main visualization techniques for any kind of flow data can be divided into four<br />
main classes. A related taxonomy can be found in [Weiskopf2007] which we summarized<br />
in figure 2.12. Furthermore some of these techniques are only valid or behave differently<br />
for steady or unsteady flow and can thus be subdivided again. Steady flow refers in<br />
this context to unchangeable vector fields and unsteady flow to changeable fields over<br />
time.<br />
• point-based direct flow visualization<br />
implies that some fixed geometry is rendered for each velocity vector. A large<br />
viewport showing enough of these representatives enables the observer to interpret<br />
the whole vector field. The problem of visual clutter and occlusion is evident for<br />
volumetric datasets.<br />
• sparse particle tracing techniques<br />
relies on calculations done based on the movement of massless particles injected<br />
into the field and envelop everything from concrete particle effects to complex<br />
trajectory integrations.<br />
• dense particle tracing techniques<br />
mostly rely on a specialized convolution of a texture with an even volumetric<br />
flow field. Again, strategies to cope with visual clutter and occlusions have to be<br />
investigated.<br />
• feature based visualization approaches<br />
20