Brandon - Hillsborough Community College
Brandon - Hillsborough Community College
Brandon - Hillsborough Community College

Create successful ePaper yourself
Turn your PDF publications into a flip-book with our unique Google optimized e-Paper software.
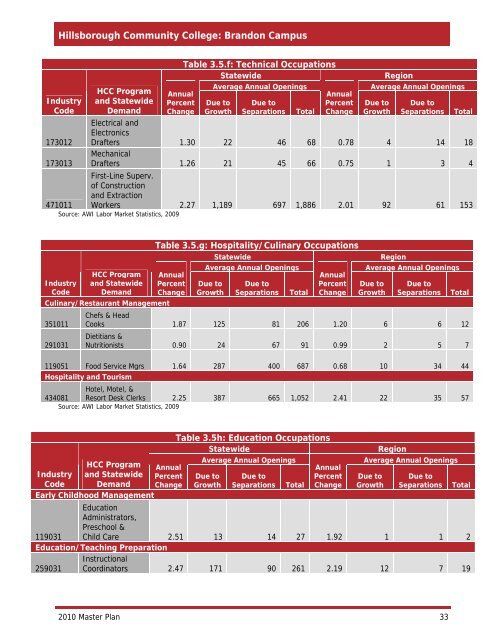
<strong>Hillsborough</strong> <strong>Community</strong> <strong>College</strong>: <strong>Brandon</strong> Campus<br />
Industry<br />
Code<br />
173012<br />
173013<br />
471011<br />
HCC Program<br />
and Statewide<br />
Demand<br />
Annual<br />
Percent<br />
Change<br />
Table 3.5.f: Technical Occupations<br />
Statewide<br />
Average Annual Openings<br />
Due to<br />
Growth<br />
Due to<br />
Separations<br />
Total<br />
Annual<br />
Percent<br />
Change<br />
Region<br />
Average Annual Openings<br />
Due to<br />
Growth<br />
Due to<br />
Separations<br />
Electrical and<br />
Electronics<br />
Drafters 1.30 22 46 68 0.78 4 14 18<br />
Mechanical<br />
Drafters 1.26 21 45 66 0.75 1 3 4<br />
First-Line Superv.<br />
of Construction<br />
and Extraction<br />
Workers 2.27 1,189 697 1,886 2.01 92 61 153<br />
Source: AWI Labor Market Statistics, 2009<br />
Total<br />
Industry<br />
Code<br />
HCC Program<br />
and Statewide<br />
Demand<br />
Culinary/Restaurant Management<br />
351011<br />
291031<br />
Table 3.5.g: Hospitality/Culinary Occupations<br />
Annual<br />
Percent<br />
Change<br />
Statewide<br />
Average Annual Openings<br />
Due to<br />
Growth<br />
Due to<br />
Separations<br />
Total<br />
Annual<br />
Percent<br />
Change<br />
Region<br />
Average Annual Openings<br />
Due to<br />
Growth<br />
Due to<br />
Separations<br />
Chefs & Head<br />
Cooks 1.87 125 81 206 1.20 6 6 12<br />
Dietitians &<br />
Nutritionists 0.90 24 67 91 0.99 2 5 7<br />
Total<br />
119051 Food Service Mgrs 1.64 287 400 687 0.68 10 34 44<br />
Hospitality and Tourism<br />
434081<br />
Hotel, Motel, &<br />
Resort Desk Clerks 2.25 387 665 1,052 2.41 22 35 57<br />
Source: AWI Labor Market Statistics, 2009<br />
HCC Program Annual<br />
Industry and Statewide Percent<br />
Code Demand Change<br />
Early Childhood Management<br />
Table 3.5h: Education Occupations<br />
Statewide<br />
Average Annual Openings<br />
Due to<br />
Growth<br />
Due to<br />
Separations<br />
Total<br />
Annual<br />
Percent<br />
Change<br />
Region<br />
Average Annual Openings<br />
Due to<br />
Growth<br />
Due to<br />
Separations<br />
119031<br />
Education<br />
Administrators,<br />
Preschool &<br />
Child Care 2.51 13 14 27 1.92 1 1 2<br />
Education/Teaching Preparation<br />
Instructional<br />
259031 Coordinators 2.47 171 90 261 2.19 12 7 19<br />
Total<br />
2010 Master Plan 33