Brandon - Hillsborough Community College
Brandon - Hillsborough Community College
Brandon - Hillsborough Community College

Create successful ePaper yourself
Turn your PDF publications into a flip-book with our unique Google optimized e-Paper software.
<strong>Hillsborough</strong> <strong>Community</strong> <strong>College</strong>: <strong>Brandon</strong> Campus<br />
According to the HCC 2009 Factbook, during the 2008-2009 school year, the <strong>Brandon</strong> Campus<br />
served a total of 10,888 students who took at least one credit/non-credit course at the campus<br />
and 568 students who took at least one Recreation and Leisure course. The 2008-2009 numbers<br />
are representative of the continued increase in the number of students enrolling in courses at the<br />
<strong>Brandon</strong> Campus. The increase has occurred for both overall headcount (which counts any student<br />
that has taken a course at the campus) and for full time equivalent (FTE) students. Projecting FTE<br />
through the Master Plan period requires an examination of historical performance, programmed<br />
growth as documented in the Educational Plant Survey (EPS), and the physical constraints of the<br />
campus. Table 3.7.a illustrates these trends.<br />
The growth of student FTE as projected in the 2010 EPS will cause associated growth in faculty<br />
and staff FTE. It should be noted that for the Fall 2008, the district employed 1,278 instructional<br />
personnel, of which 996 are part-time and 282 full-time. The <strong>Brandon</strong> Campus had an FTE of<br />
3,317 in 2009-2010, with a projection of 4,448 for 2014-2015 as documented in the EPS. The<br />
number of faculty/staff FTE combination will need to increase proportionally with the projected<br />
student FTE increases. This number of faculty/staff increase also has implications in the<br />
development of parking projections which will be addressed in the Master Plan.<br />
Table 3.7.a: Staffing From the Educational Plant Survey<br />
Year Student FTE Faculty & Staff FTE<br />
Student FTE / Faculty<br />
& Staff FTE<br />
2009-10 3,317 362.1 9.16<br />
2014-15 4,448 485.6 9.16<br />
Source: HCC Institutional Research Group<br />
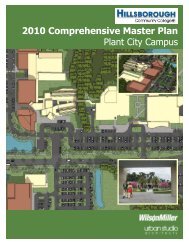
3.8 Space Needs and Campus Capacity<br />
During the campus master planning process, it was determined<br />
that space projections using the Florida Requirements for<br />
Educational Facilities are the most prudent for the master<br />
planning purposes for each of the HCC campus master plans.<br />
These requirements are documented in the Environmental Plant<br />
Survey (EPS) for the five year time horizon (through 2014-2015).<br />
These projections are documented in Table 3.8.a below. Also<br />
noted is the existing distribution of space designated as<br />
Assignable Square Feet (ASF) at the <strong>Brandon</strong> Campus.<br />
Due the linear nature of these guidelines, many of the categories<br />
tend to overestimate the space needed for a particular campus as<br />
student FTE grows. Recognition of this tendency needs to be<br />
considered within future building program development.<br />
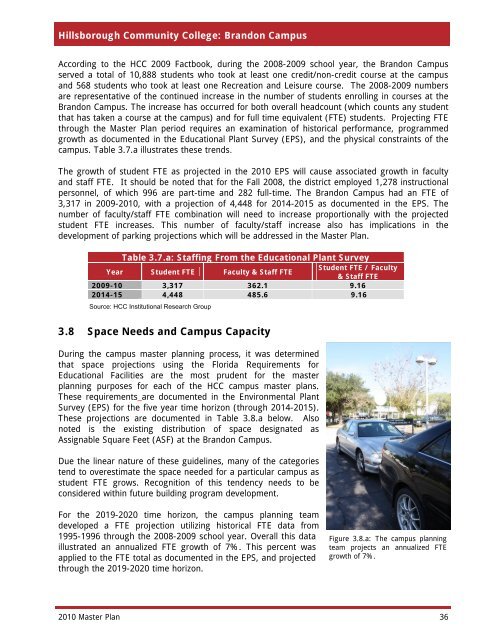
For the 2019-2020 time horizon, the campus planning team<br />
developed a FTE projection utilizing historical FTE data from<br />
1995-1996 through the 2008-2009 school year. Overall this data<br />
illustrated an annualized FTE growth of 7%. This percent was<br />
applied to the FTE total as documented in the EPS, and projected<br />
through the 2019-2020 time horizon.<br />
Figure 3.8.a: The campus planning<br />
team projects an annualized FTE<br />
growth of 7%.<br />
2010 Master Plan 36