Intermediate Algebra – Student Workbook – Second Edition 2013
Intermediate Algebra – Student Workbook – Second Edition 2013
Intermediate Algebra – Student Workbook – Second Edition 2013

You also want an ePaper? Increase the reach of your titles
YUMPU automatically turns print PDFs into web optimized ePapers that Google loves.
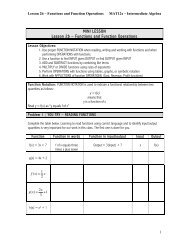
Lesson 4a <strong>–</strong> Introduction to Logarithms<br />
Mini-Lesson<br />
Why do we care about Logarithms?<br />
Logarithms are used in the sciences particularly in biology, astronomy and physics. The Richter<br />
scale measurement for earthquakes is based upon logarithms, and logarithms formed the<br />
foundation of our early computation tool (pre-calculators) called a Slide Rule.<br />
One of the unique properties of Logarithms is their ability to scale numbers of great or small size<br />
so that these numbers can be understood and compared. Let’s see how this works with an<br />
example.<br />
Problem 7 WORKED EXAMPLE <strong>–</strong> USING LOGARITHMS AS A SCALING TOOL<br />
Suppose you are given the following list of numbers and you want to plot them all on the same<br />
number line:<br />
Plot 0.00000456, 0.00372, 1.673,<br />
1356, 123,045 and 467,456,345,234.<br />
If we scale to the larger numbers,<br />
then the smaller numbers blend<br />
together and we can’t differentiate<br />
them.<br />
Let’s use logarithms and create a logarithmic scale and see how that works. First, make a table<br />
that translates your list of numbers into logarithmic form by taking the “log base 10” or common<br />
logarithm of each value.<br />
Original # 0.00000456 0.00372 1.673 1356 123,045 467,456,345,234<br />
Log (#) -5.3 -2.4 .2 3.1 5.1 11.7<br />
Then, redraw your number line and plot the logarithmic value for each number.<br />
Notice that labeling your scale as a logarithmic scale is VERY important. Otherwise, you may<br />
not remember to translate back to the actual data and you may forget that your tick marks are not<br />
unit distances.<br />
The new scale gives you an idea of the relative distance between your numbers and allows you to<br />
plot all your numbers at the same time. To understand the distance between each tick mark,<br />
remember that the tick mark label is the<br />
exponent on 10 (base of the logarithm<br />
used). So from 1 to 2 is a distance of 10 2 -<br />
10 1 = 100 - 10 = 90. The distance between 2<br />
and 3 is 10 3 <strong>–</strong> 10 2 or 1000 <strong>–</strong> 100 = 900,<br />
etc…<br />
You will learn a LOT more about logarithmic scaling if you take science classes, as this is just a<br />
very brief introduction to the idea.<br />
Scottsdale Community College Page 150 <strong>Intermediate</strong> <strong>Algebra</strong>