- Page 1 and 2:
Scottsdale Community College Interm
- Page 3 and 4:
Table of Contents Lesson 1a - Intro
- Page 5 and 6:
Lesson 1a - Introduction to Functio
- Page 7 and 8:
Name: _____________________ Date: _
- Page 9 and 10:
Lesson 1a - Introduction to Functio
- Page 11 and 12:
Lesson 1a - Introduction to Functio
- Page 13 and 14: Lesson 1a - Introduction to Functio
- Page 15 and 16: Lesson 1a - Introduction to Functio
- Page 17 and 18: Lesson 1a - Introduction to Functio
- Page 19 and 20: Lesson 1a - Introduction to Functio
- Page 21 and 22: Name: _____________________ Date: _
- Page 23 and 24: Lesson 1a - Introduction to Functio
- Page 25 and 26: Lesson 1a - Introduction to Functio
- Page 27 and 28: Lesson 1a - Introduction to Functio
- Page 29 and 30: Name: _____________________ Date: _
- Page 31 and 32: Lesson 1b - Linear Equations In the
- Page 33 and 34: Name: _____________________ Date: _
- Page 35 and 36: Lesson 1b - Linear Equations Mini-L
- Page 37 and 38: Lesson 1b - Linear Equations Mini-L
- Page 39 and 40: Lesson 1b - Linear Equations Mini-L
- Page 41 and 42: Lesson 1b - Linear Equations Mini-L
- Page 43 and 44: Lesson 1b - Linear Equations Mini-L
- Page 45 and 46: Name: _____________________ Date: _
- Page 47 and 48: Lesson 1b - Linear Equations Practi
- Page 49 and 50: Lesson 1b - Linear Equations Practi
- Page 51 and 52: Lesson 1b - Linear Equations Practi
- Page 53 and 54: Name: _____________________ Date: _
- Page 55 and 56: Lesson 2a - Linear Functions and Ap
- Page 57 and 58: Name: _____________________ Date: _
- Page 59 and 60: Lesson 2a - Linear Functions and Ap
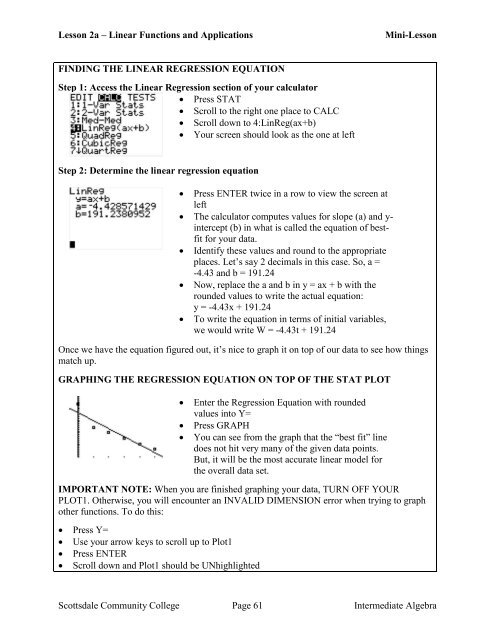
- Page 61 and 62: Lesson 2a - Linear Functions and Ap
- Page 63: Lesson 2a - Linear Functions and Ap
- Page 67 and 68: Lesson 2a - Linear Functions and Ap
- Page 69 and 70: Name: _____________________ Date: _
- Page 71 and 72: Lesson 2a - Linear Functions and Ap
- Page 73 and 74: Lesson 2a - Linear Functions and Ap
- Page 75 and 76: Name: _____________________ Date: _
- Page 77 and 78: Lesson 2b - Functions and Function
- Page 79 and 80: Name: _____________________ Date: _
- Page 81 and 82: Lesson 2b - Functions and Function
- Page 83 and 84: Lesson 2b - Functions and Function
- Page 85 and 86: Lesson 2b - Functions and Function
- Page 87 and 88: Lesson 2b - Functions and Function
- Page 89 and 90: Lesson 2b - Functions and Function
- Page 91 and 92: Name: _____________________ Date: _
- Page 93 and 94: Lesson 2b - Functions and Function
- Page 95 and 96: Lesson 2b - Functions and Function
- Page 97 and 98: Name: _____________________ Date: _
- Page 99 and 100: Lesson 3a - Introduction to Exponen
- Page 101 and 102: Name: _____________________ Date: _
- Page 103 and 104: Lesson 3a - Introduction to Exponen
- Page 105 and 106: Lesson 3a - Introduction to Exponen
- Page 107 and 108: Lesson 3a - Introduction to Exponen
- Page 109 and 110: Lesson 3a - Introduction to Exponen
- Page 111 and 112: Lesson 3a - Introduction to Exponen
- Page 113 and 114: Lesson 3a - Introduction to Exponen
- Page 115 and 116:
Lesson 3a - Introduction to Exponen
- Page 117 and 118:
Name: _____________________ Date: _
- Page 119 and 120:
Lesson 3a - Introduction to Exponen
- Page 121 and 122:
Lesson 3a - Introduction to Exponen
- Page 123 and 124:
Name: _____________________ Date: _
- Page 125 and 126:
Lesson 3b - More Exponential Functi
- Page 127 and 128:
Name: _____________________ Date: _
- Page 129 and 130:
Lesson 3b - More Exponential Functi
- Page 131 and 132:
Lesson 3b - More Exponential Functi
- Page 133 and 134:
Lesson 3b - More Exponential Functi
- Page 135 and 136:
Lesson 3b - More Exponential Functi
- Page 137 and 138:
Name: _____________________ Date: _
- Page 139 and 140:
Lesson 3b - More Exponential Functi
- Page 141 and 142:
Lesson 3b - More Exponential Functi
- Page 143 and 144:
Lesson 3b - More Exponential Functi
- Page 145 and 146:
Name: _____________________ Date: _
- Page 147 and 148:
Lesson 4a - Introduction to Logarit
- Page 149 and 150:
Name: _____________________ Date: _
- Page 151 and 152:
Lesson 4a - Introduction to Logarit
- Page 153 and 154:
Lesson 4a - Introduction to Logarit
- Page 155 and 156:
Lesson 4a - Introduction to Logarit
- Page 157 and 158:
Lesson 4a - Introduction to Logarit
- Page 159 and 160:
Name: _____________________ Date: _
- Page 161 and 162:
Lesson 4a - Introduction to Logarit
- Page 163 and 164:
Name: _____________________ Date: _
- Page 165 and 166:
Lesson 4b - More on Logarithms This
- Page 167 and 168:
Name: _____________________ Date: _
- Page 169 and 170:
Lesson 4b - More on Logarithms Mini
- Page 171 and 172:
Lesson 4b - More on Logarithms Mini
- Page 173 and 174:
Lesson 4b - More on Logarithms Mini
- Page 175 and 176:
Lesson 4b - More on Logarithms Mini
- Page 177 and 178:
Name: _____________________ Date: _
- Page 179 and 180:
Lesson 4b - More on Logarithms Prac
- Page 181 and 182:
Lesson 4b - More on Logarithms Prac
- Page 183 and 184:
Lesson 4b - More on Logarithms Prac
- Page 185 and 186:
Name: _____________________ Date: _
- Page 187 and 188:
Lesson 5a - Introduction to Quadrat
- Page 189 and 190:
Name: _____________________ Date: _
- Page 191 and 192:
Lesson 5a - Introduction to Quadrat
- Page 193 and 194:
Lesson 5a - Introduction to Quadrat
- Page 195 and 196:
Lesson 5a - Introduction to Quadrat
- Page 197 and 198:
Lesson 5a - Introduction to Quadrat
- Page 199 and 200:
Lesson 5a - Introduction to Quadrat
- Page 201 and 202:
Name: _____________________ Date: _
- Page 203 and 204:
Lesson 5a - Introduction to Quadrat
- Page 205 and 206:
Lesson 5a - Introduction to Quadrat
- Page 207 and 208:
Lesson 5a - Introduction to Quadrat
- Page 209 and 210:
Name: _____________________ Date: _
- Page 211 and 212:
Lesson 5b - Solving Quadratic Equat
- Page 213 and 214:
Name: _____________________ Date: _
- Page 215 and 216:
Lesson 5b - Solving Quadratic Equat
- Page 217 and 218:
Lesson 5b - Solving Quadratic Equat
- Page 219 and 220:
Lesson 5b - Solving Quadratic Equat
- Page 221 and 222:
Lesson 5b - Solving Quadratic Equat
- Page 223 and 224:
Lesson 5b - Solving Quadratic Equat
- Page 225 and 226:
Lesson 5b - Solving Quadratic Equat
- Page 227 and 228:
Lesson 5b - Solving Quadratic Equat
- Page 229 and 230:
Lesson 5b - Solving Quadratic Equat
- Page 231 and 232:
Name: _____________________ Date: _
- Page 233 and 234:
Lesson 5b - Solving Quadratic Equat
- Page 235 and 236:
Lesson 5b - Solving Quadratic Equat
- Page 237 and 238:
Lesson 5b - Solving Quadratic Equat
- Page 239 and 240:
Lesson 5b - Solving Quadratic Equat
- Page 241 and 242:
Name: _____________________ Date: _
- Page 243 and 244:
Lesson 6a - Exponents and Rational
- Page 245 and 246:
Name: _____________________ Date: _
- Page 247 and 248:
Lesson 6a - Exponents and Rational
- Page 249 and 250:
Lesson 6a - Exponents and Rational
- Page 251 and 252:
Lesson 6a - Exponents and Rational
- Page 253 and 254:
Lesson 6a - Exponents and Rational
- Page 255 and 256:
Lesson 6a - Exponents and Rational
- Page 257 and 258:
Name: _____________________ Date: _
- Page 259 and 260:
Lesson 6a - Exponents and Rational
- Page 261 and 262:
Lesson 6a - Exponents and Rational
- Page 263 and 264:
Lesson 6a - Exponents and Rational
- Page 265 and 266:
Name: _____________________ Date: _
- Page 267 and 268:
Lesson 6b - Rational Exponents & Ra
- Page 269 and 270:
Name: _____________________ Date: _
- Page 271 and 272:
Lesson 6b - Rational Exponents and
- Page 273 and 274:
Lesson 6b - Rational Exponents and
- Page 275 and 276:
Lesson 6b - Rational Exponents and
- Page 277 and 278:
Lesson 6b - Rational Exponents and
- Page 279 and 280:
Name: _____________________ Date: _
- Page 281 and 282:
Lesson 6b - Rational Exponents and
- Page 283 and 284:
Lesson 6b - Rational Exponents and
- Page 285 and 286:
Name: _____________________ Date: _
- Page 287 and 288:
Appendix A: You Try Answers Lesson
- Page 289 and 290:
Appendix A: You Try Answers You Try
- Page 291 and 292:
Appendix A: You Try Answers You Try
- Page 293 and 294:
Appendix A: You Try Answers You Try


