Download Full Version - UMC
Download Full Version - UMC
Download Full Version - UMC

Create successful ePaper yourself
Turn your PDF publications into a flip-book with our unique Google optimized e-Paper software.
Financial Review Consolidated<br />
143<br />
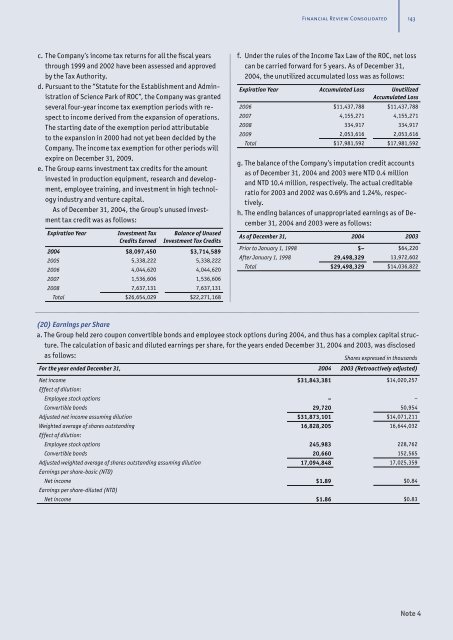
c. The Company’s income tax returns for all the fiscal years<br />
through 1999 and 2002 have been assessed and approved<br />
by the Tax Authority.<br />
d. Pursuant to the “Statute for the Establishment and Administration<br />
of Science Park of ROC”, the Company was granted<br />
several four-year income tax exemption periods with respect<br />
to income derived from the expansion of operations.<br />
The starting date of the exemption period attributable<br />
to the expansion in 2000 had not yet been decided by the<br />
Company. The income tax exemption for other periods will<br />
expire on December 31, 2009.<br />
e. The Group earns investment tax credits for the amount<br />
invested in production equipment, research and development,<br />
employee training, and investment in high technology<br />
industry and venture capital.<br />
As of December 31, 2004, the Group’s unused investment<br />
tax credit was as follows:<br />
Expiration Year<br />
Investment Tax<br />
Credits Earned<br />
Balance of Unused<br />
Investment Tax Credits<br />
2004 $8,097,450 $3,714,589<br />
2005 5,338,222 5,338,222<br />
2006 4,044,620 4,044,620<br />
2007 1,536,606 1,536,606<br />
2008 7,637,131 7,637,131<br />
Total $26,654,029 $22,271,168<br />
f. Under the rules of the Income Tax Law of the ROC, net loss<br />
can be carried forward for 5 years. As of December 31,<br />
2004, the unutilized accumulated loss was as follows:<br />
Expiration Year Accumulated Loss Unutilized<br />
Accumulated Loss<br />
2006 $11,437,788 $11,437,788<br />
2007 4,155,271 4,155,271<br />
2008 334,917 334,917<br />
2009 2,053,616 2,053,616<br />
Total $17,981,592 $17,981,592<br />
g. The balance of the Company’s imputation credit accounts<br />
as of December 31, 2004 and 2003 were NTD 0.4 million<br />
and NTD 10.4 million, respectively. The actual creditable<br />
ratio for 2003 and 2002 was 0.69% and 1.24%, respectively.<br />
h. The ending balances of unappropriated earnings as of December<br />
31, 2004 and 2003 were as follows:<br />
As of December 31, 2004 2003<br />
Prior to January 1, 1998 $– $64,220<br />
After January 1, 1998 29,498,329 13,972,602<br />
Total $29,498,329 $14,036,822<br />
(20) Earnings per Share<br />
a. The Group held zero coupon convertible bonds and employee stock options during 2004, and thus has a complex capital structure.<br />
The calculation of basic and diluted earnings per share, for the years ended December 31, 2004 and 2003, was disclosed<br />
as follows:<br />
Shares expressed in thousands<br />
For the year ended December 31, 2004 2003 (Retroactively adjusted)<br />
Net income $31,843,381 $14,020,257<br />
Effect of dilution:<br />
Employee stock options – –<br />
Convertible bonds 29,720 50,954<br />
Adjusted net income assuming dilution $31,873,101 $14,071,211<br />
Weighted average of shares outstanding 16,828,205 16,644,032<br />
Effect of dilution:<br />
Employee stock options 245,983 228,762<br />
Convertible bonds 20,660 152,565<br />
Adjusted weighted average of shares outstanding assuming dilution 17,094,848 17,025,359<br />
Earnings per share-basic (NTD)<br />
Net income $1.89 $0.84<br />
Earnings per share-diluted (NTD)<br />
Net income $1.86 $0.83<br />
Note 4