Download Full Version - UMC
Download Full Version - UMC
Download Full Version - UMC

Create successful ePaper yourself
Turn your PDF publications into a flip-book with our unique Google optimized e-Paper software.
Financial Review Unconsolidated<br />
67<br />
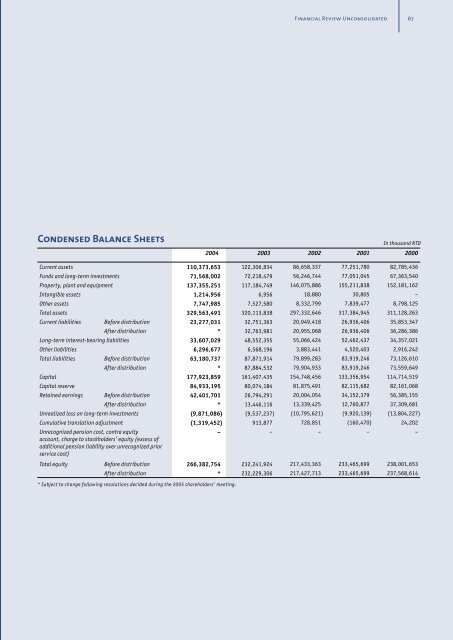
Condensed Balance Sheets<br />
In thousand NTD<br />
2004 2003 2002 2001 2000<br />
Current assets 110,373,653 122,306,834 86,658,337 77,251,780 82,785,436<br />
Funds and long-term investments 71,568,002 72,218,479 56,246,744 77,051,045 67,363,540<br />
Property, plant and equipment 137,355,251 117,184,749 146,075,886 155,211,838 152,181,162<br />
Intangible assets 1,214,956 6,956 18,880 30,805 –<br />
Other assets 7,747,985 7,527,580 8,332,799 7,839,477 8,798,125<br />
Total assets 329,563,491 320,113,838 297,332,646 317,384,945 311,128,263<br />
Current liabilities Before distribution 23,277,031 32,751,363 20,949,418 26,936,406 35,853,347<br />
After distribution * 32,763,981 20,955,068 26,936,406 36,286,386<br />
Long-term interest-bearing liabilities 33,607,029 48,552,355 55,066,424 52,462,437 34,357,021<br />
Other liabilities 6,296,677 6,568,196 3,883,441 4,520,403 2,916,242<br />
Total liabilities Before distribution 63,180,737 87,871,914 79,899,283 83,919,246 73,126,610<br />
After distribution * 87,884,532 79,904,933 83,919,246 73,559,649<br />
Capital 177,923,859 161,407,435 154,748,456 133,356,954 114,714,519<br />
Capital reserve 84,933,195 80,074,184 81,875,491 82,115,682 82,161,068<br />
Retained earnings Before distribution 42,401,701 26,794,291 20,004,054 34,152,379 56,385,155<br />
After distribution * 13,446,116 13,339,425 12,760,877 37,309,681<br />
Unrealized loss on long-term investments (9,871,086) (9,537,237) (10,795,621) (9,920,139) (13,804,227)<br />
Cumulative translation adjustment (1,319,452) 913,877 728,851 (160,470) 24,202<br />
Unrecognized pension cost, contra equity<br />
account, charge to stockholders’ equity (excess of<br />
additional pension liability over unrecognized prior<br />
service cost)<br />
– – – – –<br />
Total equity Before distribution 266,382,754 232,241,924 217,433,363 233,465,699 238,001,653<br />
After distribution * 232,229,306 217,427,713 233,465,699 237,568,614<br />
* Subject to change following resolutions decided during the 2005 shareholders’ meeting.