Download Full Version - UMC
Download Full Version - UMC
Download Full Version - UMC

You also want an ePaper? Increase the reach of your titles
YUMPU automatically turns print PDFs into web optimized ePapers that Google loves.
Corporate Overview<br />
39<br />
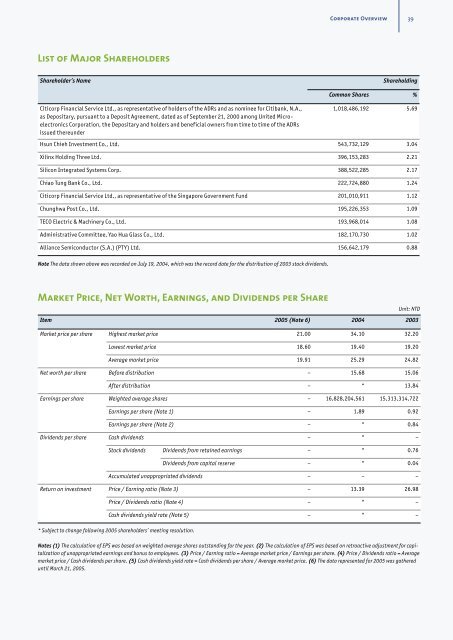
List of Major Shareholders<br />
Shareholder’s Name<br />
Shareholding<br />
Common Shares %<br />
Citicorp Financial Service Ltd., as representative of holders of the ADRs and as nominee for Citibank, N.A.,<br />
as Depositary, pursuant to a Deposit Agreement, dated as of September 21, 2000 among United Microelectronics<br />
Corporation, the Depositary and holders and beneficial owners from time to time of the ADRs<br />
issued thereunder<br />
1,018,486,192 5.69<br />
Hsun Chieh Investment Co., Ltd. 543,732,129 3.04<br />
Xilinx Holding Three Ltd. 396,153,283 2.21<br />
Silicon Integrated Systems Corp. 388,522,285 2.17<br />
Chiao Tung Bank Co., Ltd. 222,724,880 1.24<br />
Citicorp Financial Service Ltd., as representative of the Singapore Government Fund 201,010,911 1.12<br />
Chunghwa Post Co., Ltd. 195,226,353 1.09<br />
TECO Electric & Machinery Co., Ltd. 193,968,014 1.08<br />
Administrative Committee, Yao Hua Glass Co., Ltd. 182,170,730 1.02<br />
Alliance Semiconductor (S.A.) (PTY) Ltd. 156,642,179 0.88<br />
Note The data shown above was recorded on July 19, 2004, which was the record date for the distribution of 2003 stock dividends.<br />
Market Price, Net Worth, Earnings, and Dividends per Share<br />
Unit: NTD<br />
Item 2005 (Note 6) 2004 2003<br />
Market price per share Highest market price 21.00 34.10 32.20<br />
Lowest market price 18.60 19.40 19.20<br />
Average market price 19.91 25.29 24.82<br />
Net worth per share Before distribution – 15.68 15.06<br />
After distribution – * 13.84<br />
Earnings per share Weighted average shares – 16,828,204,561 15,313,314,722<br />
Earnings per share (Note 1) – 1.89 0.92<br />
Earnings per share (Note 2) – * 0.84<br />
Dividends per share Cash dividends – * –<br />
Stock dividends Dividends from retained earnings – * 0.76<br />
Dividends from capital reserve – * 0.04<br />
Accumulated unappropriated dividends – – –<br />
Return on investment Price / Earning ratio (Note 3) – 13.39 26.98<br />
Price / Dividends ratio (Note 4) – * –<br />
Cash dividends yield rate (Note 5) – * –<br />
* Subject to change following 2005 shareholders’ meeting resolution.<br />
Notes (1) The calculation of EPS was based on weighted average shares outstanding for the year. (2) The calculation of EPS was based on retroactive adjustment for capitalization<br />
of unappropriated earnings and bonus to employees. (3) Price / Earning ratio = Average market price / Earnings per share. (4) Price / Dividends ratio = Average<br />
market price / Cash dividends per share. (5) Cash dividends yield rate = Cash dividends per share / Average market price. (6) The data represented for 2005 was gathered<br />
until March 21, 2005.