Year 2007
Year 2007
Year 2007

You also want an ePaper? Increase the reach of your titles
YUMPU automatically turns print PDFs into web optimized ePapers that Google loves.
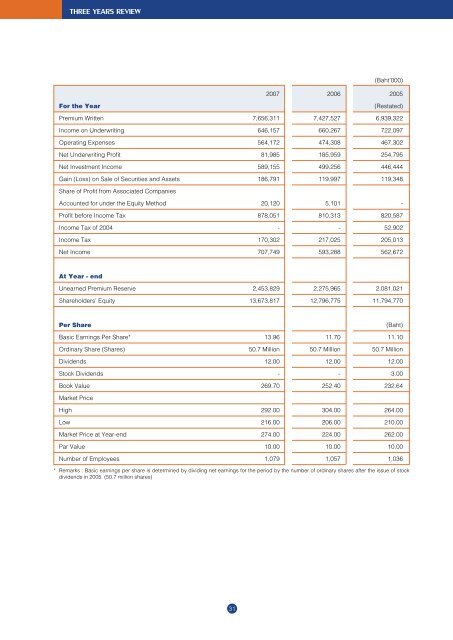
THREE YEARS REVIEW<br />
(Baht’000)<br />
<strong>2007</strong> 2006 2005<br />
For the <strong>Year</strong><br />
(Restated)<br />
Premium Written 7,656,311 7,427,527 6,939,322<br />
Income on Underwriting 646,157 660,267 722,097<br />
Operating Expenses 564,172 474,308 467,302<br />
Net Underwriting Profit 81,985 185,959 254,795<br />
Net Investment Income 589,155 499,256 446,444<br />
Gain (Loss) on Sale of Securities and Assets 186,791 119,997 119,348<br />
Share of Profit from Associated Companies<br />
Accounted for under the Equity Method 20,120 5,101 -<br />
Profit before Income Tax 878,051 810,313 820,587<br />
Income Tax of 2004 - - 52,902<br />
Income Tax 170,302 217,025 205,013<br />
Net Income 707,749 593,288 562,672<br />
At <strong>Year</strong> - end<br />
Unearned Premium Reserve 2,453,829 2,275,965 2,081,021<br />
Shareholders’ Equity 13,673,817 12,796,775 11,794,770<br />
Per Share<br />
(Baht)<br />
Basic Earnings Per Share* 13.96 11.70 11.10<br />
Ordinary Share (Shares) 50.7 Million 50.7 Million 50.7 Million<br />
Dividends 12.00 12.00 12.00<br />
Stock Dividends - - .00<br />
Book Value 269.70 252.40 232.64<br />
Market Price<br />
High 292.00 04.00 264.00<br />
Low 216.00 206.00 210.00<br />
Market Price at <strong>Year</strong>-end 274.00 224.00 262.00<br />
Par Value 10.00 10.00 10.00<br />
Number of Employees 1,079 1,057 1,036<br />
* Remarks : Basic earnings per share is determined by dividing net earnings for the period by the number of ordinary shares after the issue of stock<br />
dividends in 2005. (50.7 million shares)<br />
31